Add model statistics returned from broom::glance(). Statistics can either
be appended to the table (add_glance_table()), or added as a
table source note (add_glance_source_note()).
add_glance_table(
  x,
  include = everything(),
  label = NULL,
  fmt_fun = NULL,
  glance_fun = NULL
)

add_glance_source_note(
  x,
  include = everything(),
  label = NULL,
  fmt_fun = NULL,
  glance_fun = NULL,
  text_interpret = c("md", "html"),
  sep1 = " = ",
  sep2 = "; "
)
Arguments
- x
'tbl_regression' object
- include
list of statistics to include in output. Must be column names of the tibble returned by
broom::glance(). The include argument can also be used to specify the order the statistics appear in the table.- label
List of formulas specifying statistic labels, e.g.
list(r.squared ~ "R2", p.value ~ "P")- fmt_fun
List of formulas where the LHS is a statistic and the RHS is a function to format/round the statistics. The default is to round the number of observations and degrees of freedom to the nearest integer, p-values are styled with
style_pvalue()and the remaining statistics are styled withstyle_sigfig(x, digits = 3)- glance_fun
function that returns model statistics. Default is
broom::glance()for most model obejcts, andbroom::glance(mice::pool())for MICE 'mira' models. Custom functions must return a single row tibble.- text_interpret
String indicates whether source note text will be interpreted with
gt::md()orgt::html(). Must be"md"(default) or"html".- sep1
Separator between statistic name and statistic. Default is
" = ", e.g."R2 = 0.456"- sep2
Separator between statistics. Default is
"; "
Value
gtsummary table
Default Labels
The following statistics have set default labels when printed.
When there is no default, the column name from broom::glance() is printed.
| Statistic Name | Default Label |
| r.squared | R² |
| adj.r.squared | Adjusted R² |
| p.value | p-value |
| logLik | Log-likelihood |
| statistic | Statistic |
| df.residual | Residual df |
| null.deviance | Null deviance |
| df.null | Null df |
| nevent | N events |
| concordance | c-index |
| std.error.concordance | c-index SE |
| nobs | No. Obs. |
| deviance | Deviance |
| sigma | Sigma |
Tips
When combining add_glance_table() with tbl_merge(), the
ordering of the model terms and the glance statistics may become jumbled.
To re-order the rows with glance statistics on bottom, use the script below:
tbl_merge(list(tbl1, tbl2)) %>%
  modify_table_body(~.x %>% arrange(row_type == "glance_statistic"))
Example Output
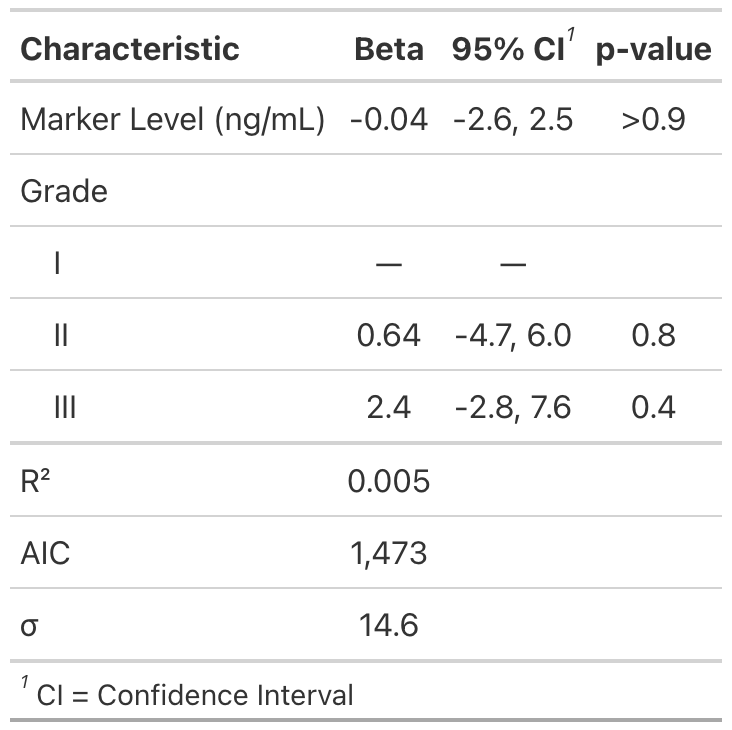
Example 1
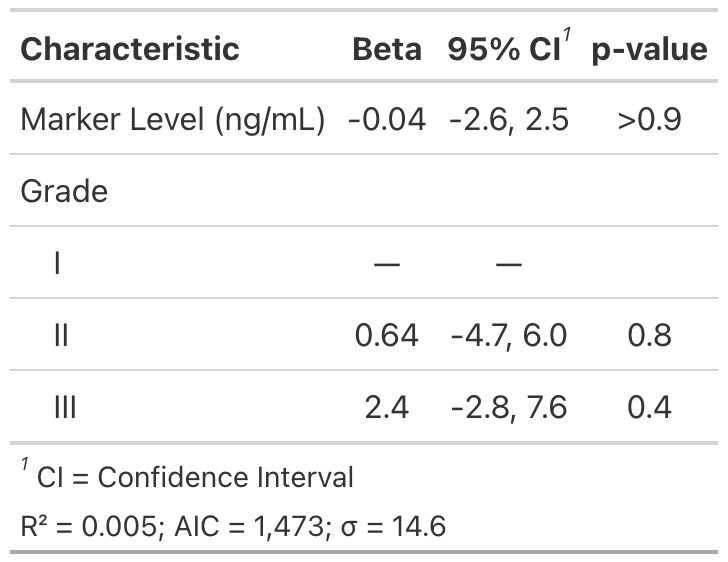
Example 2
See also
Review list, formula, and selector syntax used throughout gtsummary
Examples
# \donttest{
mod <- lm(age ~ marker + grade, trial) %>% tbl_regression()

# Example 1 ----------------------------------
add_glance_ex1 <-
  mod %>%
  add_glance_table(
    label = list(sigma ~ "\U03C3"),
    include = c(r.squared, AIC, sigma)
  )

# Example 2 ----------------------------------
add_glance_ex2 <-
  mod %>%
  add_glance_source_note(
    label = list(sigma ~ "\U03C3"),
    include = c(r.squared, AIC, sigma)
  )
# }