Beyond {gtsummary}
How the {crane} Package Extends the Framework for Pharma Reporting
What is {crane} ? 
{crane} is the Roche extension to {gtsummary} for Roche’s reporting requirements
{crane} exports a {gtsummary} theme
{crane} exports functions to bespoke summary tables
But First, What is {gtsummary} ?
How it started
Began to address reproducibility issues while working in academia
Goal to build a package to summarize study results with code that was both simple and customizable
How it’s going
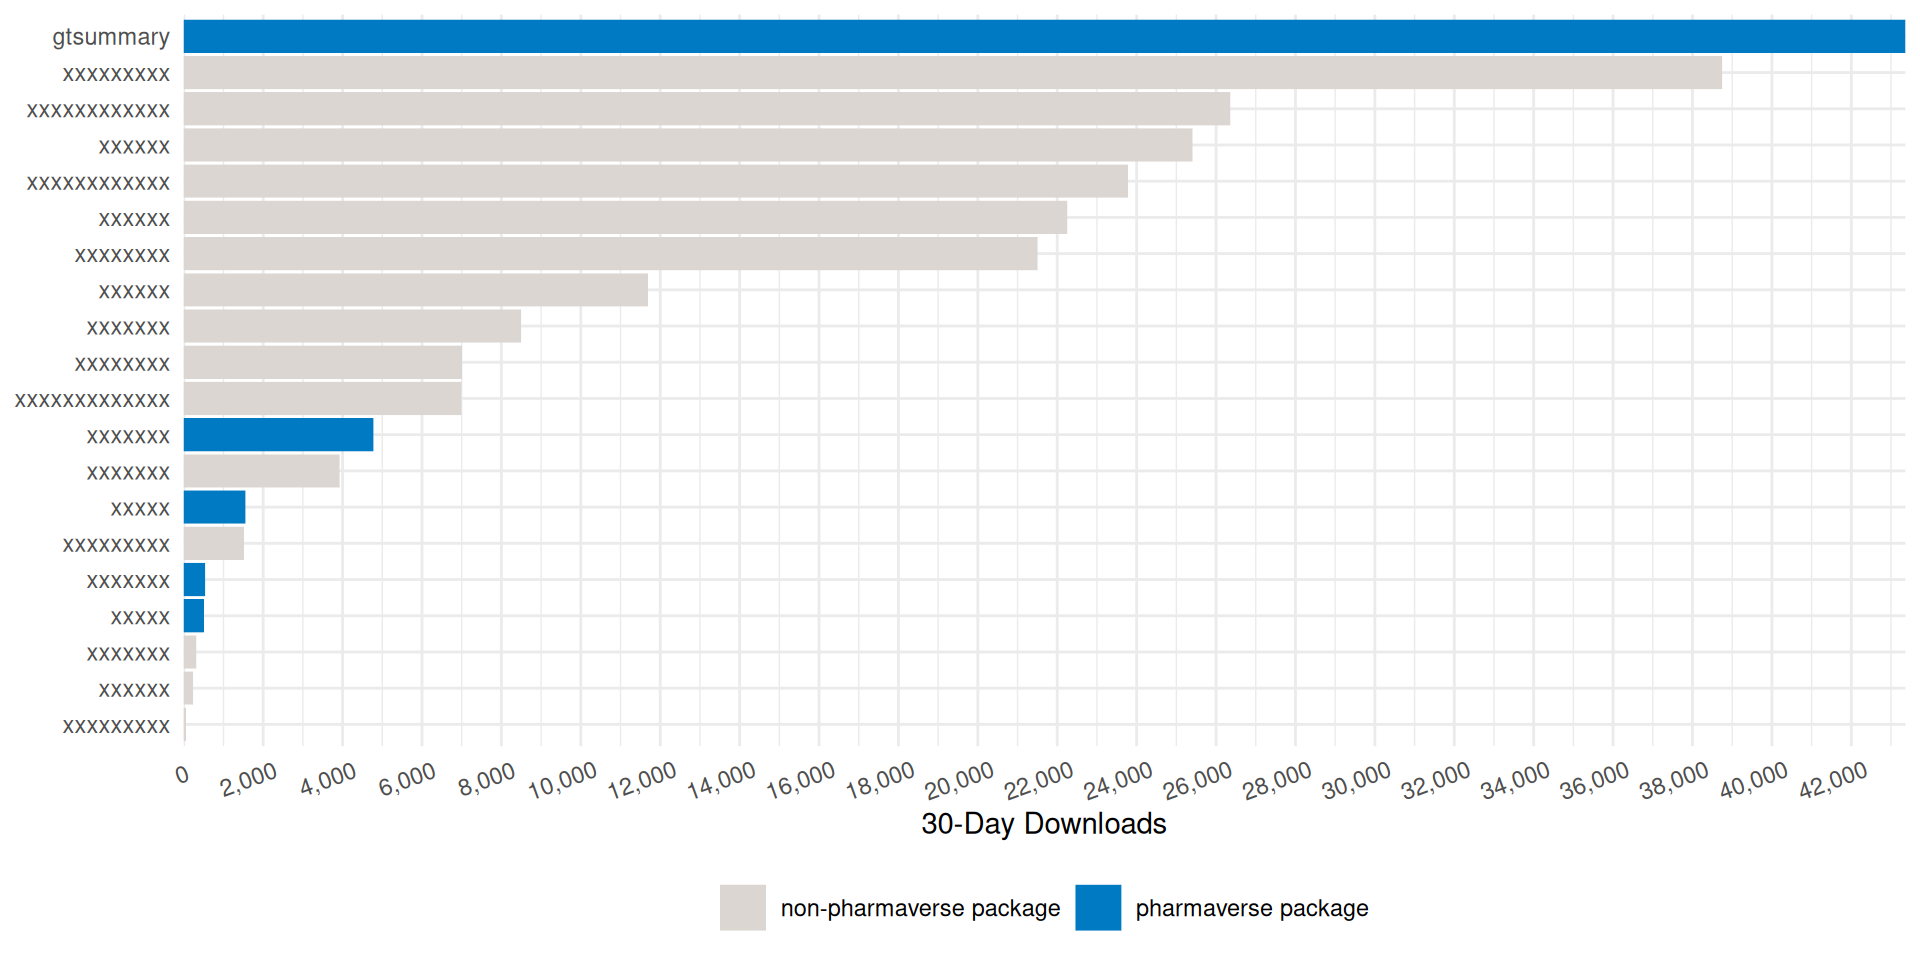
The stats
- 1,700,000 installations from CRAN
- 1,200 GitHub stars
- 1,000 citations in peer-reviewed articles
- 50 code contributors
Won the 2021 American Statistical Association (ASA) Innovation in Programming Award
Won the 2024 Posit Pharma Table Contest
Won the 2025 Brian Bole Award of Excellence from R in Pharma


{gtsummary} + LLMs
Since {gtsummary} is widely adopted, our LLMs besties work wonderfully out of the box. No additional training needed!
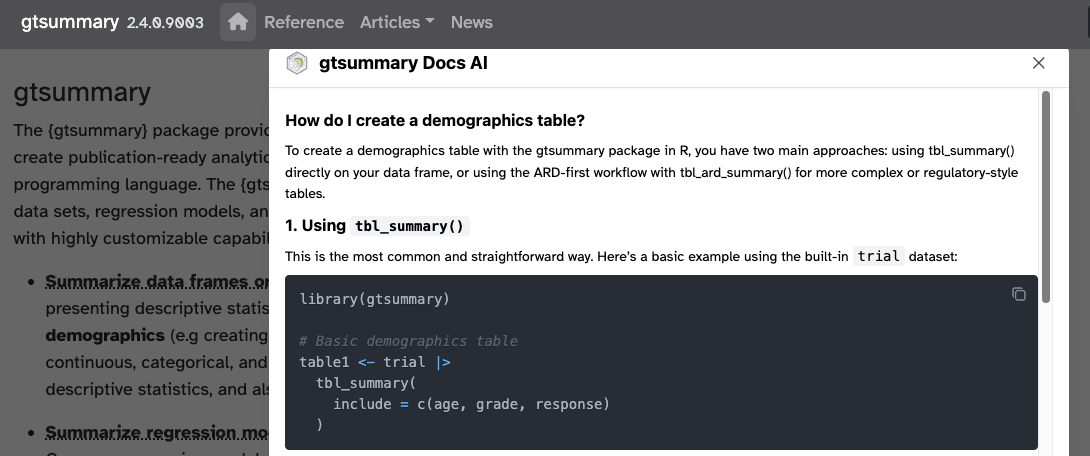
The {gtsummary} site has recently added an AI assistant and it’s AMAZING! Powered by
kapa.ai(thank you!)
This Talk is Not about {gtsummary}
But, I want to touch on two items
{gtsummary} creates beautiful tables that are easy to customize
{gtsummary} supports themes that allow users to change defaults and other details of summary tables
{gtsummary} Tables
We will review briefly just one summary table function.
tbl_summary()
Other functions helpful functions we’re not covering:
tbl_hierarchical(): Summarize AE, Con Meds, and other similar ratestbl_hierarchical_count(): similar totbl_hierarchical()for counts instead of ratestbl_cross(): cross tabulationstbl_continuous(): summarizing continuous variables by 2 categorical variablestbl_wide_summary(): similar totbl_summary()but statistics are presented in separate columnsmany more!
{gtsummary} + formulas
This syntax is also used in {cards}, {cardx}, {crane}, and {gt}.
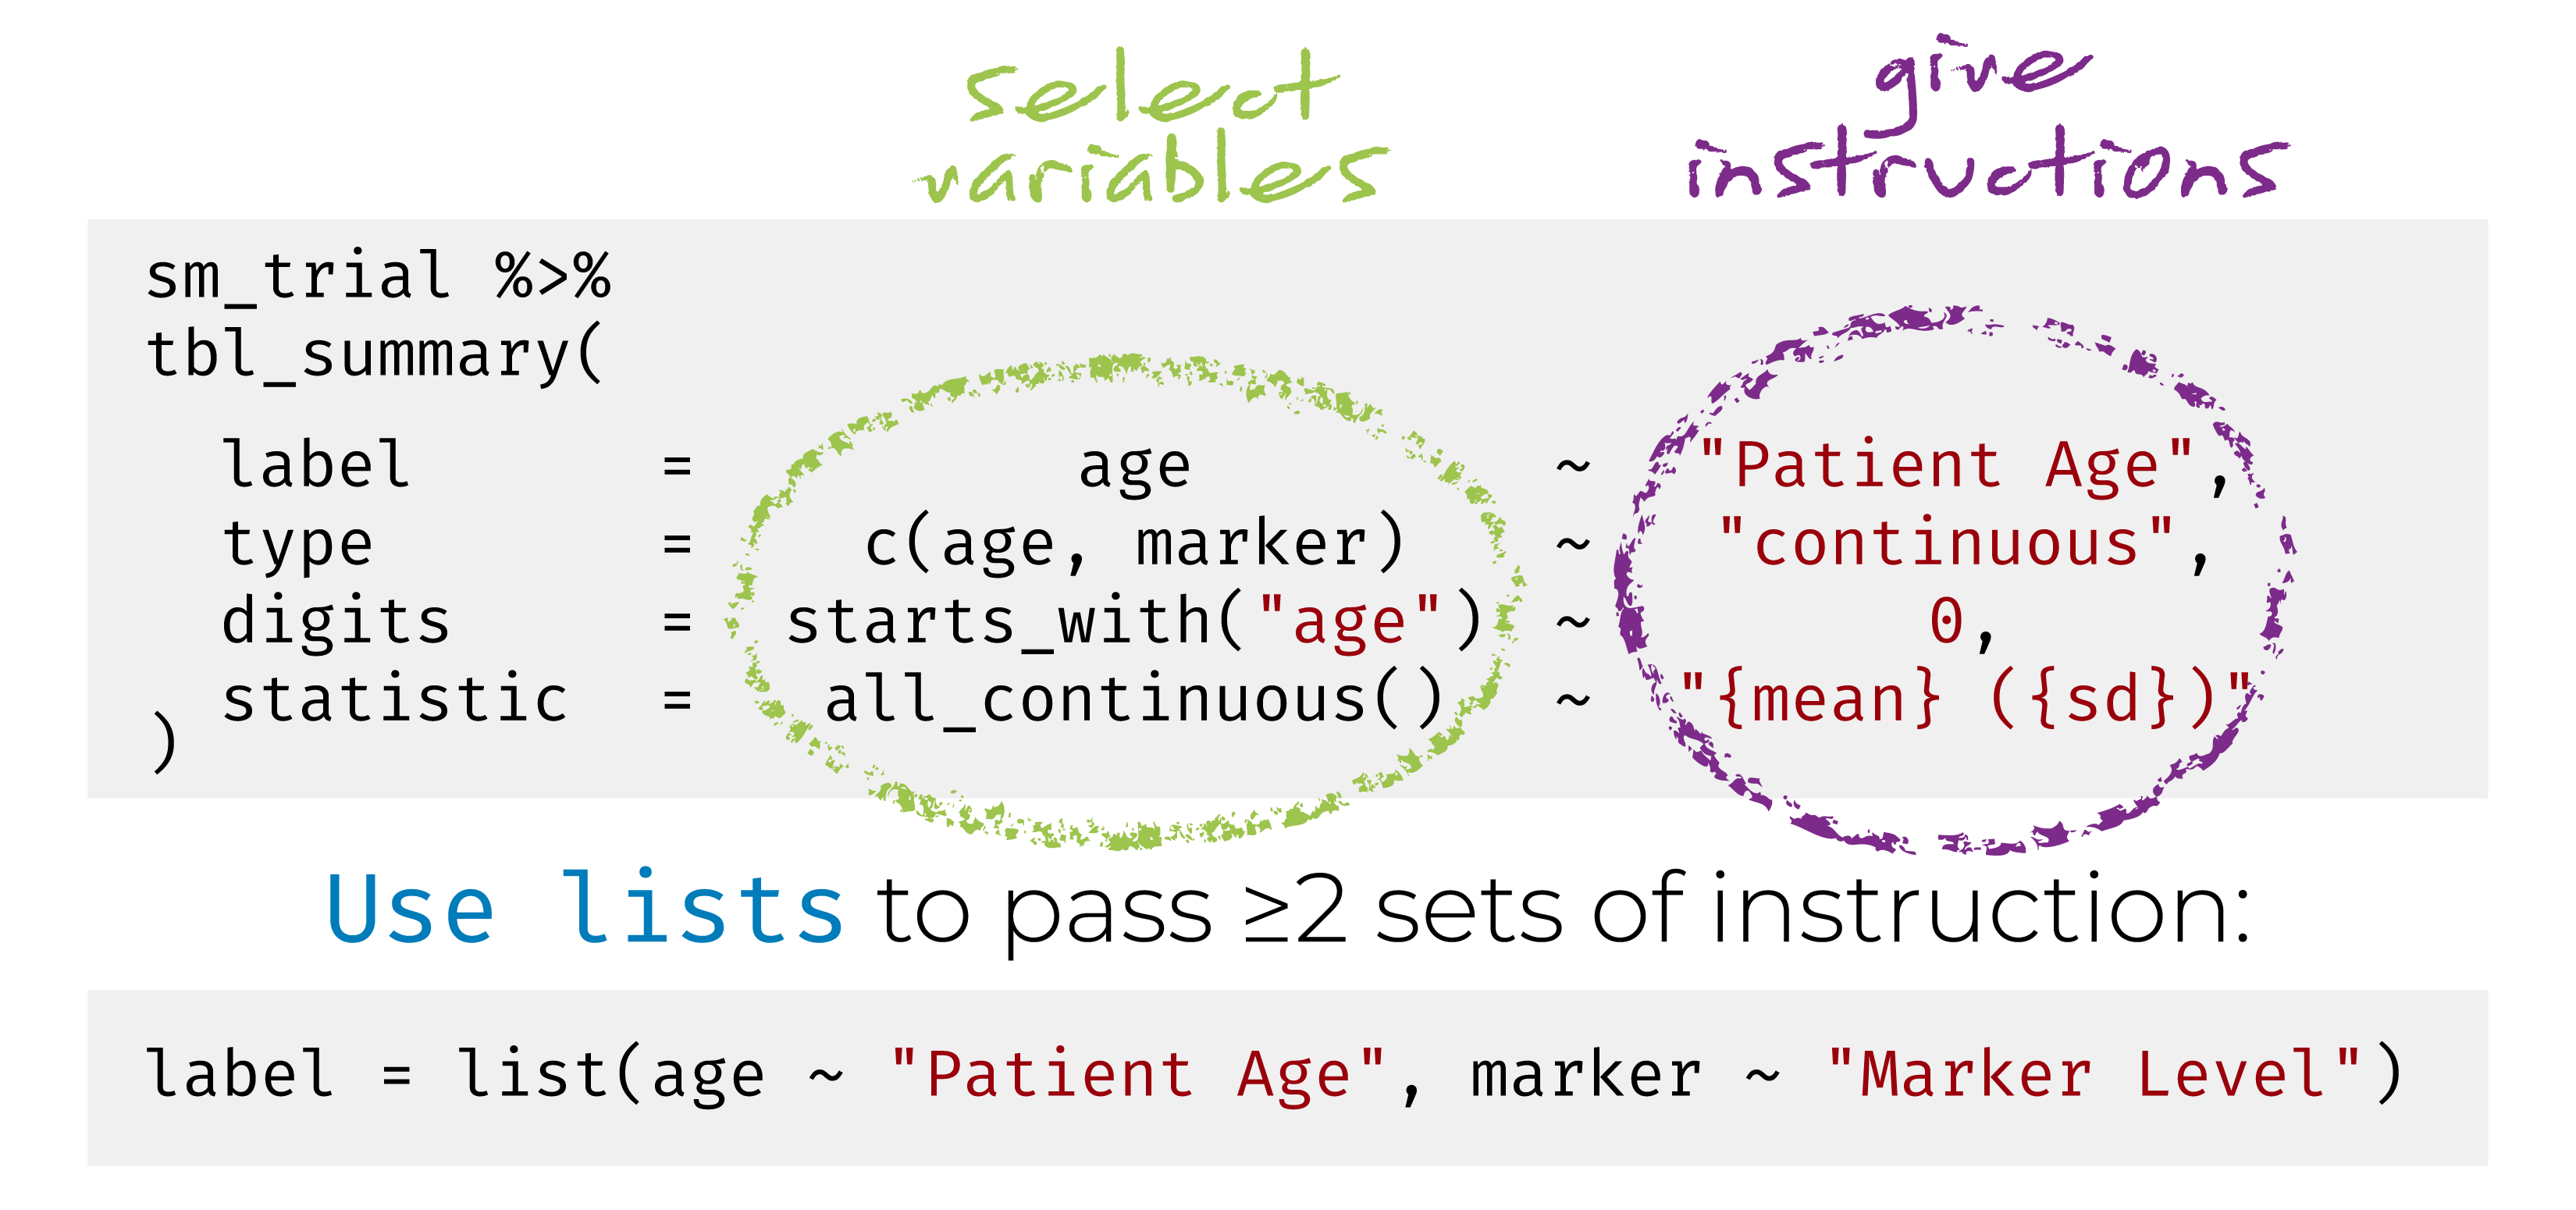
Named list are OK too! label = list(age = "Patient Age")
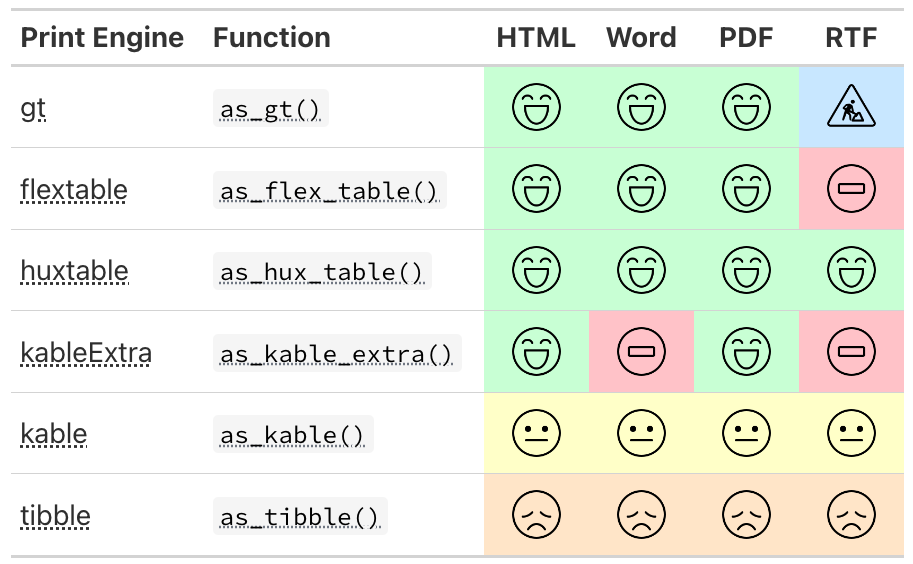
{gtsummary} print engines
Finally, All About {crane}

Wrapping Functions
The first function we added to {crane} was tbl_roche_summary(): a very thin wrapper for gtsummary::tbl_summary().
Continuous variables default to
continuous2.tbl_summary(missing*)arguments have been changed totbl_roche_summary(nonmissing*).- We highlight non-missing counts over missing counts, which are the default in {gtsummary}
Counts represented by
0 (0%)print as0.
Wrapping Functions
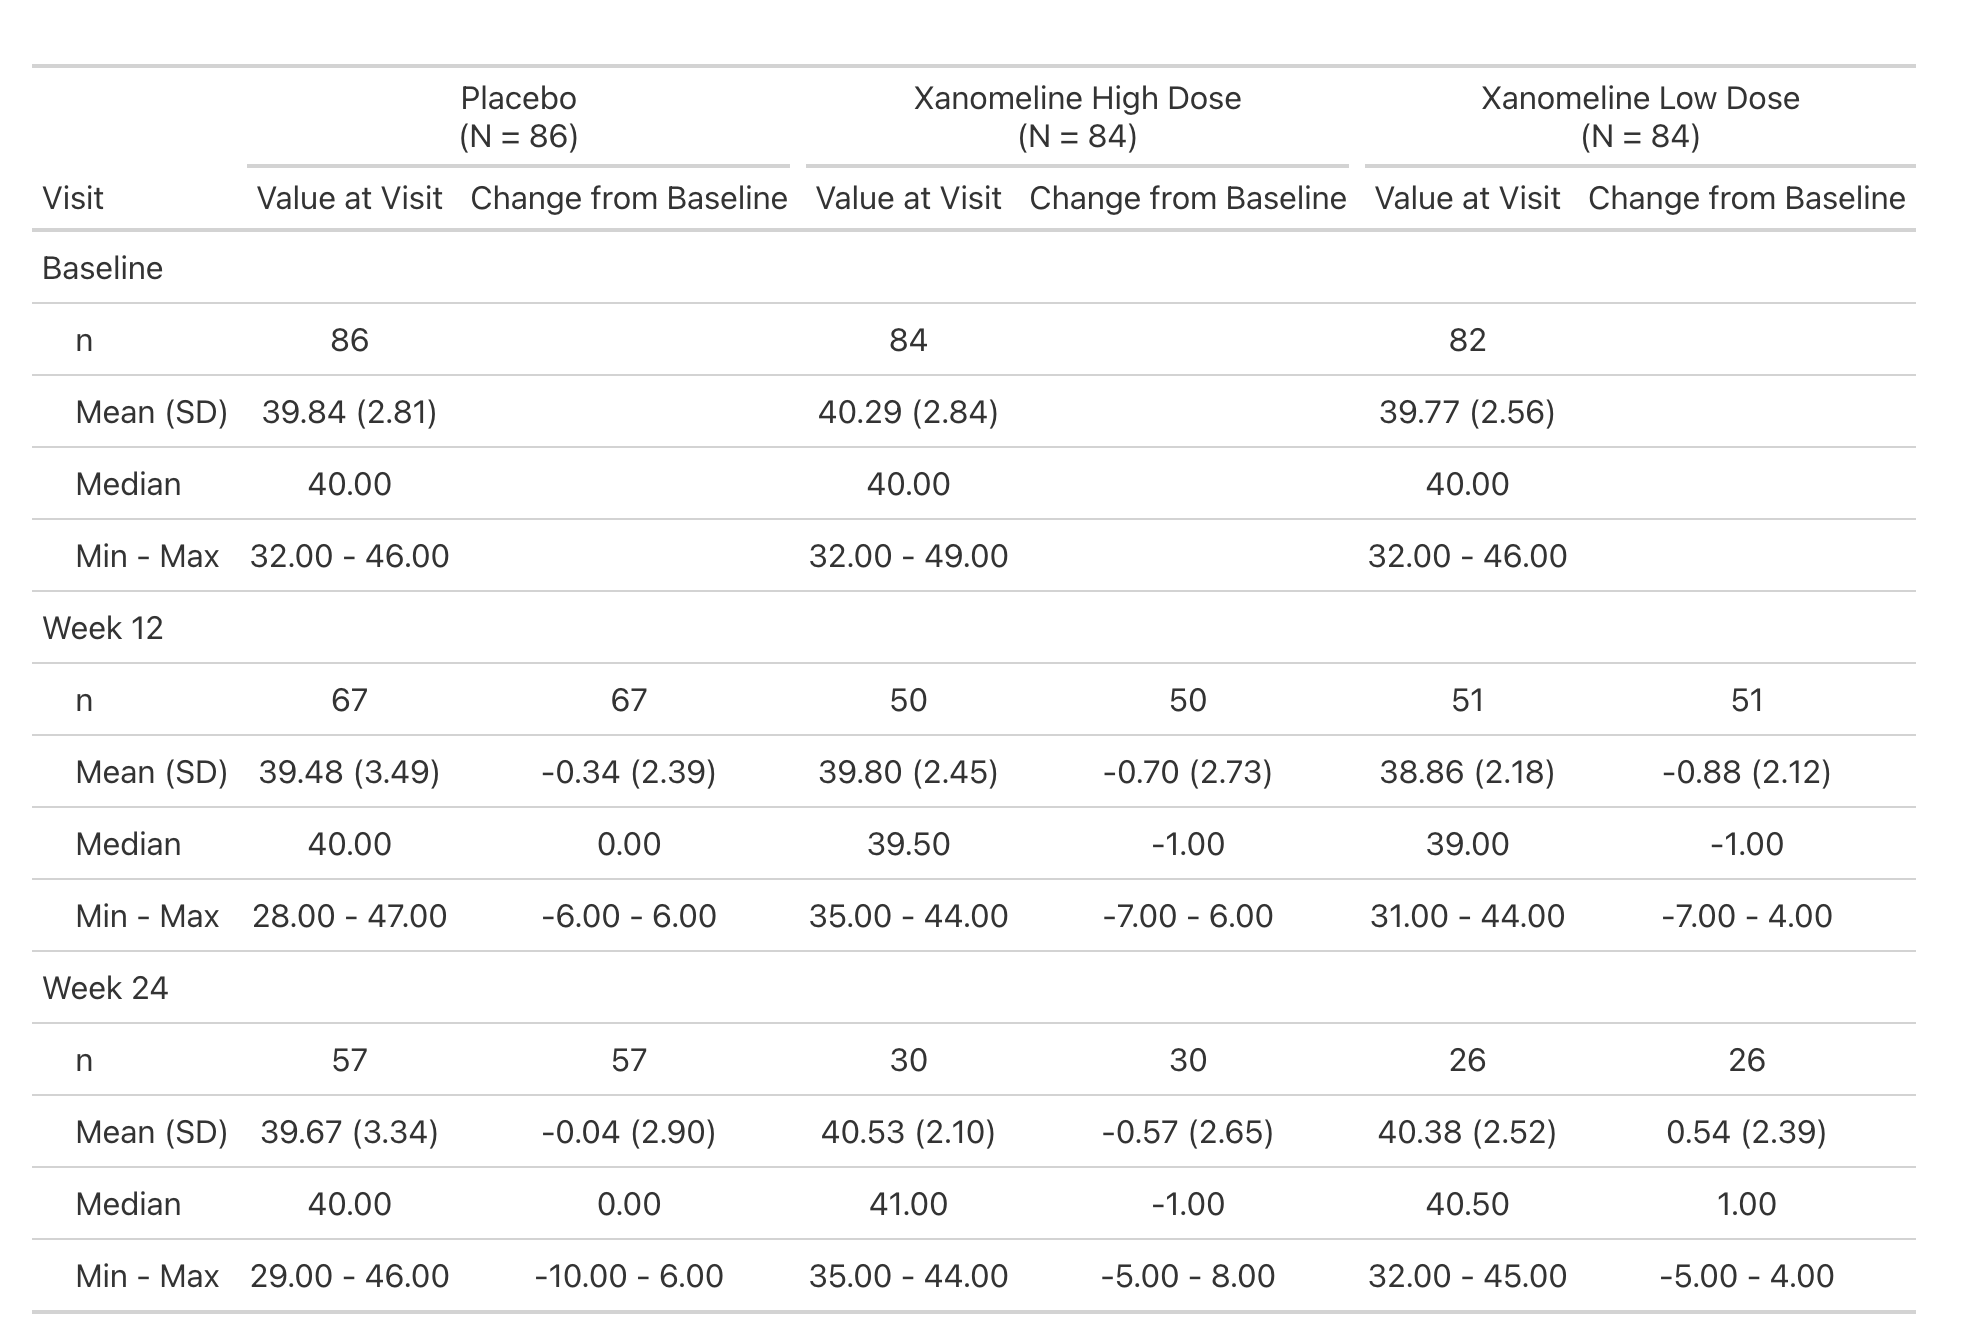
Extending with New Functions
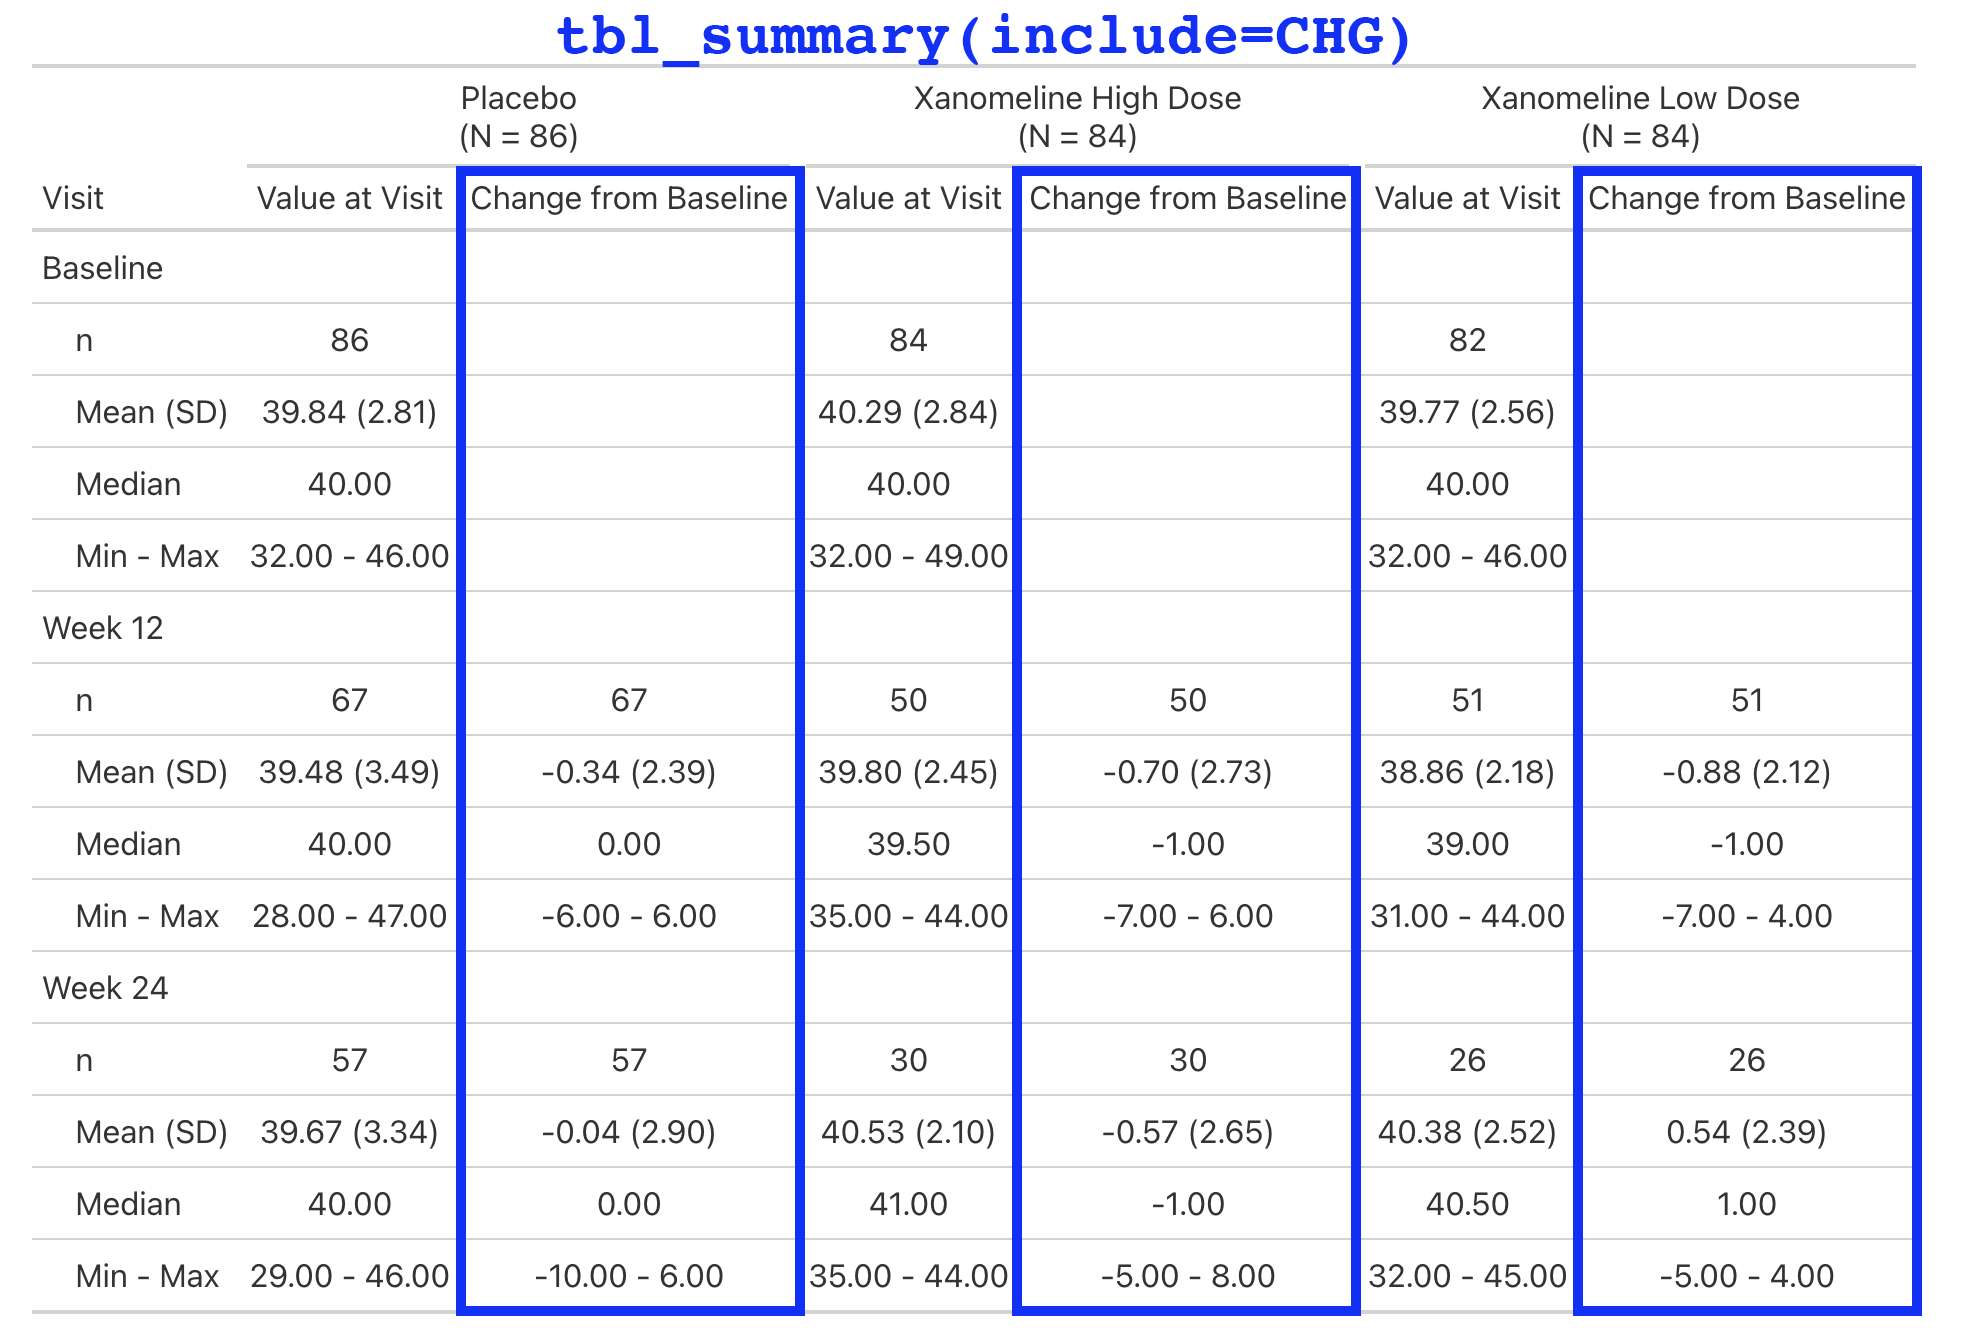
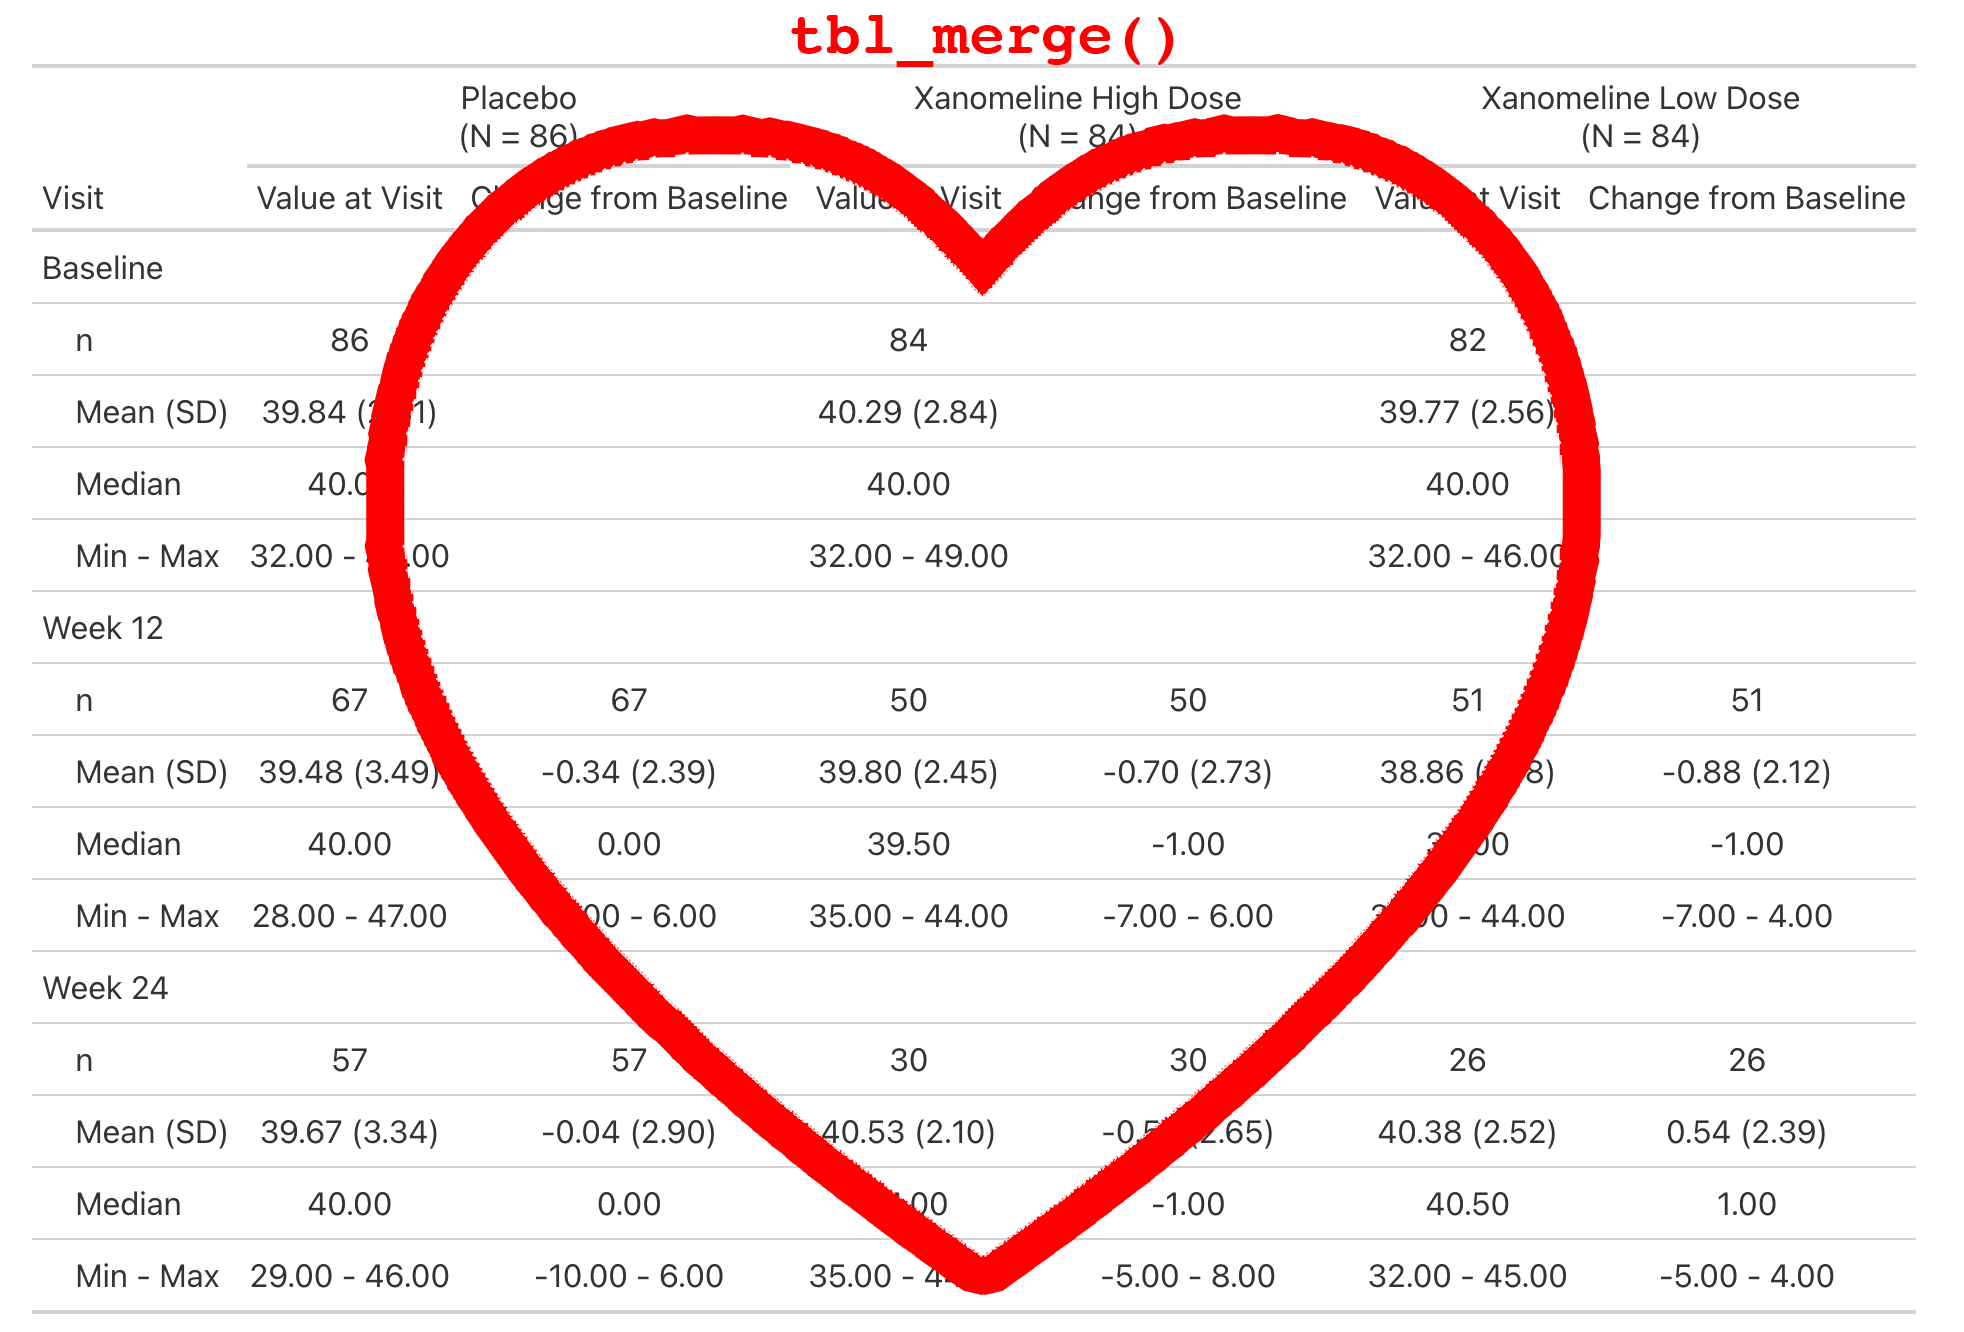
Lab values are summarized by visit and include the change from baseline.
This is a simple table that is just a tbl_merge() of the AVAL summary and the CHG summary.
But the general structure appears enough times in our catalog, we make it simple for our programmers to create.
Extending with New Functions
Extending with New Functions
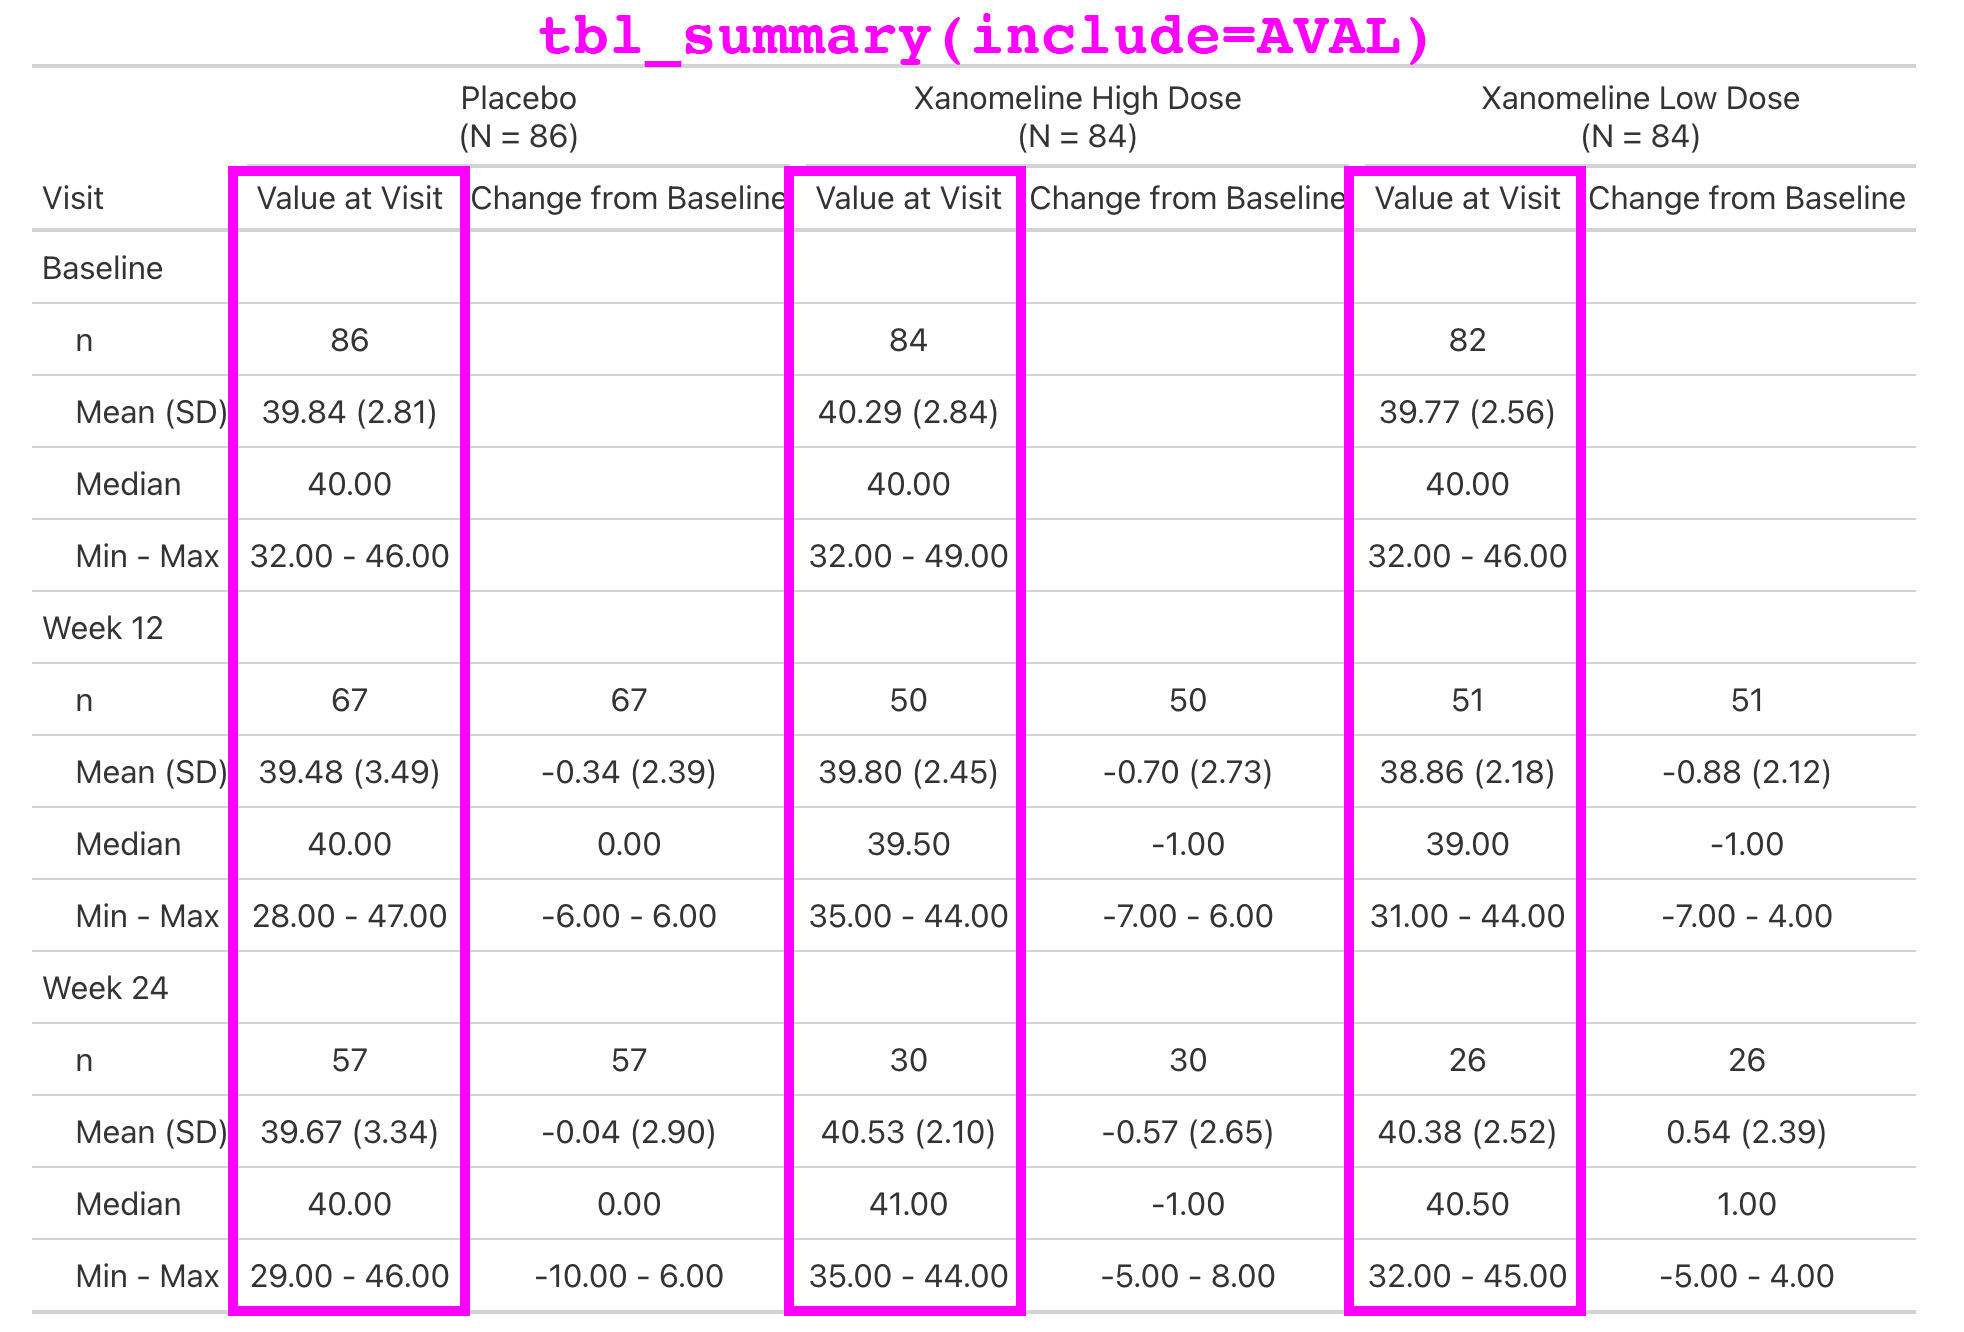
Extending with New Functions
Extending with New Functions
Create a Company Theme
Our theme is implemented in crane::theme_gtsummary_roche()
Primary changes include:
Sets a custom function for rounding percentages.
Round all p-values to four decimal places.
Headers default to include the N in parenthesis without bold, e.g.
'Placebo \n (N = 184)'.All tables are printed with {flextable} and we add Roche-specific styling to the table.
- Update the default font, font size, table borders, cell padding, etc. to meet our guidelines.
Create a Company Theme
Placebo | Xanomeline | |
|---|---|---|
Age | ||
n | 86 | 168 |
Mean (SD) | 75 (9) | 75 (8) |
Median | 76 | 77 |
Min - Max | 52 - 89 | 51 - 88 |
ETHNIC | ||
n | 86 | 168 |
HISPANIC OR LATINO | 3 (3.5%) | 9 (5.4%) |
NOT HISPANIC OR LATINO | 83 (96.5%) | 159 (94.6%) |
REFUSED | 0 | 0 |
Extend with ARD-first Functionality
We don’t have time to cover in detail, but there is another wonderful way to create bespoke tables and functions.
The {gtsummary} package supports creating tables using ARDs (Analysis Results Datasets).
- Data ➡️ ARD ➡️ Table
This method is particularly useful for efficacy tables, as they contain statistics that are not our standard rates, counts, and univariate descriptor statistics.
Review the ARD-first Vignette for a detailed walk through.
Extend with ARD-first Functionality
When it comes time to build your custom tables, use the {crane} package as a blueprint.