Test Consequences
Arguments
- formula
a formula with the outcome on the LHS and a sum of markers/covariates to test on the RHS
- data
a data frame containing the variables in
formula=.- statistics
Character vector with statistics to return. See below for details
- thresholds
vector of threshold probabilities between 0 and 1. Default is
seq(0, 0.99, by = 0.01). Thresholds at zero are replaced with 10e-10.- label
named list of variable labels, e.g.
list(age = "Age, years")- time
if outcome is survival,
time=specifies the time the assessment is made- prevalence
When
NULL, the prevalence is estimated fromdata=. If the data passed is a case-control set, the population prevalence may be set with this argument.
Value
a tibble with test consequences
statistics
The following diagnostic statistics are available to return.
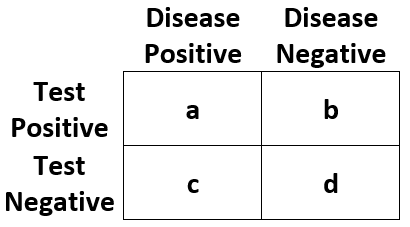
| Statistic | Abbreviation | Definition |
| Outcome Positive Rate | "pos_rate" | (a + c) / (a + b + c + d) |
| Outcome Negative Rate | "neg_rate" | (b + d) / (a + b + c + d) |
| Test Positive Rate | "test_pos_rate" | (a + b) / (a + b + c + d) |
| Test Negative Rate | "test_neg_rate" | (c + d) / (a + b + c + d) |
| True Positive Rate | "tp_rate" | a / (a + b + c + d) |
| False Positive Rate | "fp_rate" | b / (a + b + c + d) |
| False Negative Rate | "fn_rate" | c / (a + b + c + d) |
| True Negative Rate | "tn_rate" | d / (a + b + c + d) |
| Positive Predictive Value | "ppv" | a / (a + b) |
| Negative Predictive Value | "npv" | d / (c + d) |
| Sensitivity | "sens" | a / (a + c) |
| Specificity | "spec" | d / (b + d) |
| Positive Likelihood Ratio | "lr_pos" | sens / (1 - spec) |
| Negative Likelihood Ratio | "lr_neg" | (1 - sens) / spec |
Examples
test_consequences(cancer ~ cancerpredmarker, data = df_binary)
#> # A tibble: 5 × 18
#>   variable   label     n threshold pos_rate neg_rate test_pos_rate test_neg_rate
#>   <chr>      <fct> <int>     <dbl>    <dbl>    <dbl>         <dbl>         <dbl>
#> 1 cancerpre… canc…   750      0        0.14     0.86        1              0
#> 2 cancerpre… canc…   750      0.25     0.14     0.86        0.192          0.808
#> 3 cancerpre… canc…   750      0.5      0.14     0.86        0.0667         0.933
#> 4 cancerpre… canc…   750      0.75     0.14     0.86        0.0187         0.981
#> 5 cancerpre… canc…   750      1        0.14     0.86        0              1
#> # ℹ 10 more variables: tp_rate <dbl>, fp_rate <dbl>, fn_rate <dbl>,
#> #   tn_rate <dbl>, ppv <dbl>, npv <dbl>, sens <dbl>, spec <dbl>, lr_pos <dbl>,
#> #   lr_neg <dbl>