Add a confidence interval represented by either a ribbon or lines.
Usage
add_confidence_interval(type = c("ribbon", "lines"), ...)See also
Visit the gallery for examples modifying the default figures
Examples
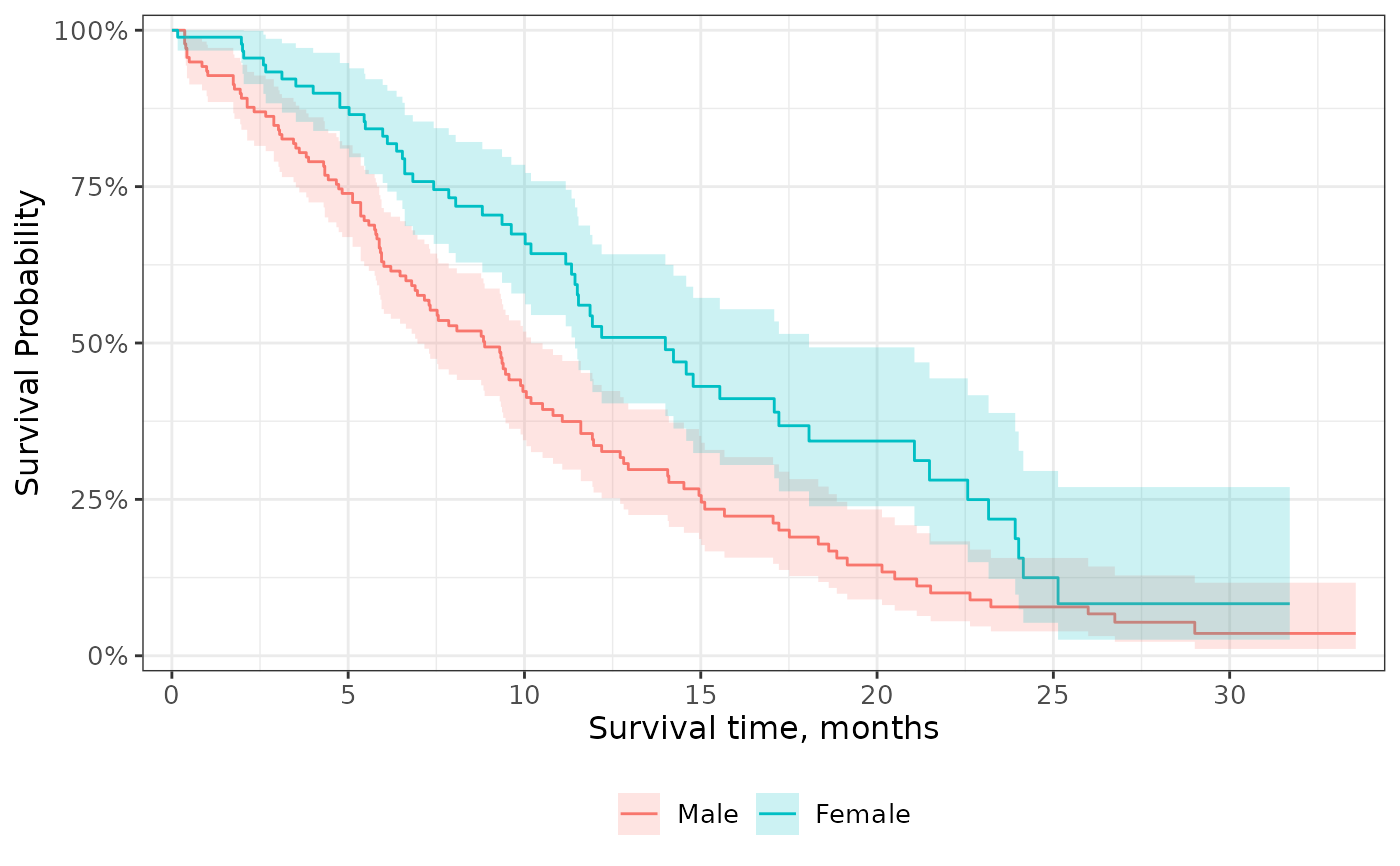
survfit2(Surv(time, status) ~ sex, data = df_lung) %>%
ggsurvfit() +
add_confidence_interval() +
scale_ggsurvfit()
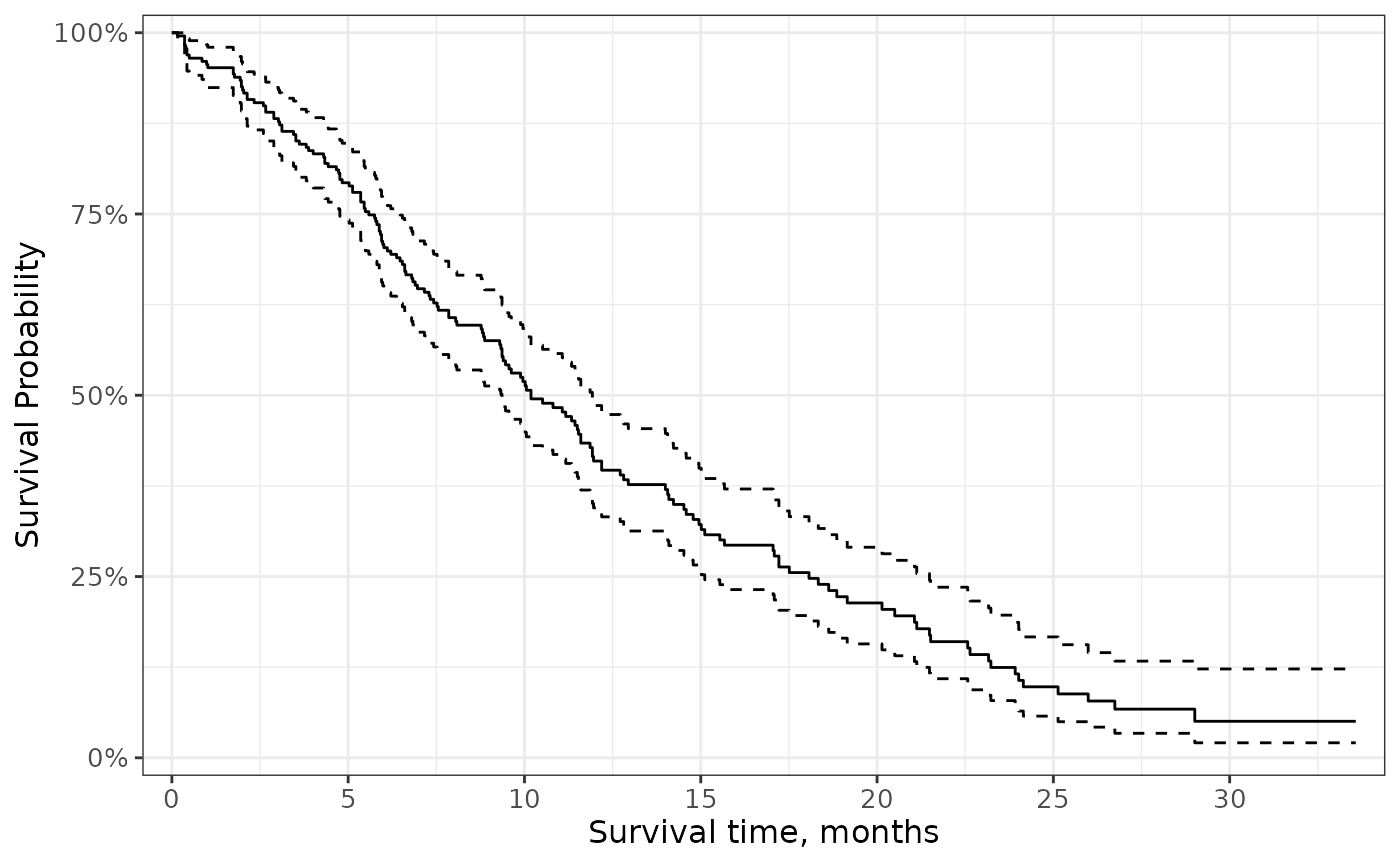
 survfit2(Surv(time, status) ~ 1, data = df_lung) %>%
ggsurvfit() +
add_confidence_interval(type = "lines") +
scale_ggsurvfit()
survfit2(Surv(time, status) ~ 1, data = df_lung) %>%
ggsurvfit() +
add_confidence_interval(type = "lines") +
scale_ggsurvfit()