Very experimental and early stage package for creating forest plots from gtsummary tables. The result is a gt table that includes the plot.
Installation
You can install the development version of gtforester from GitHub with:
# install.packages("devtools")
devtools::install_github("ddsjoberg/gtforester")
Example
library(gtforester)
#> Loading required package: gtsummary

tbl <-
  trial %>%
  select(age, marker, grade, response) %>%
  tbl_uvregression(
    y = response,
    method = glm,
    method.args = list(family = binomial),
    exponentiate = TRUE,
    hide_n = TRUE
  ) %>%
  modify_column_merge(
    pattern = "{estimate} (95% CI {ci}; {p.value})",
    rows = !is.na(estimate)
  ) %>%
  modify_header(estimate = "**Odds Ratio**") %>%
  bold_labels() %>%
  add_forest()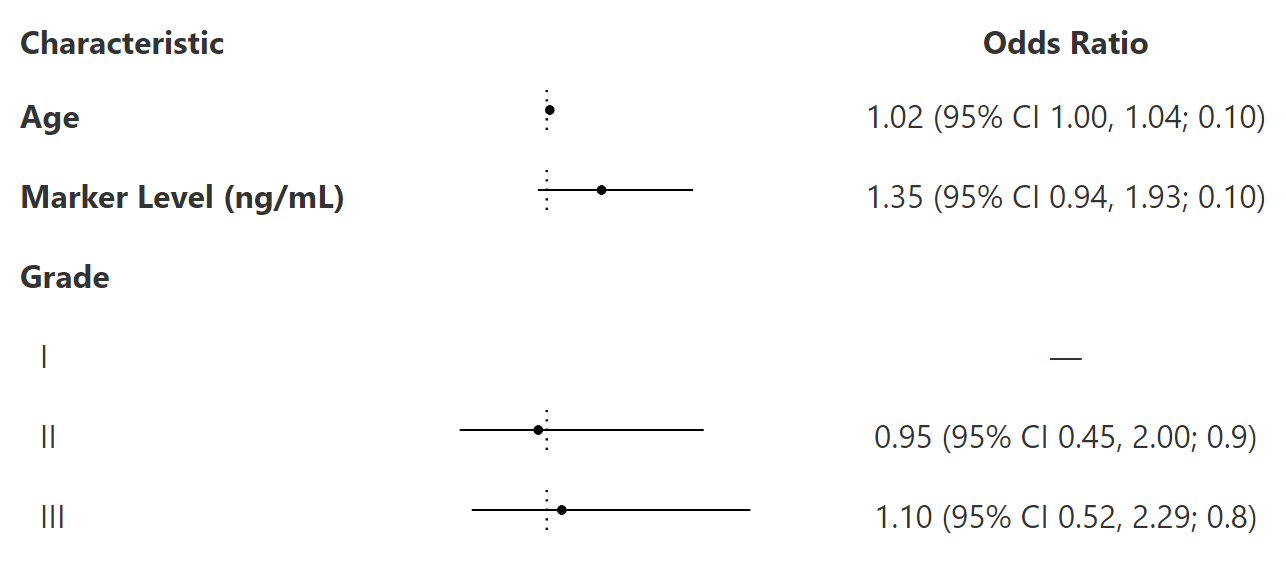
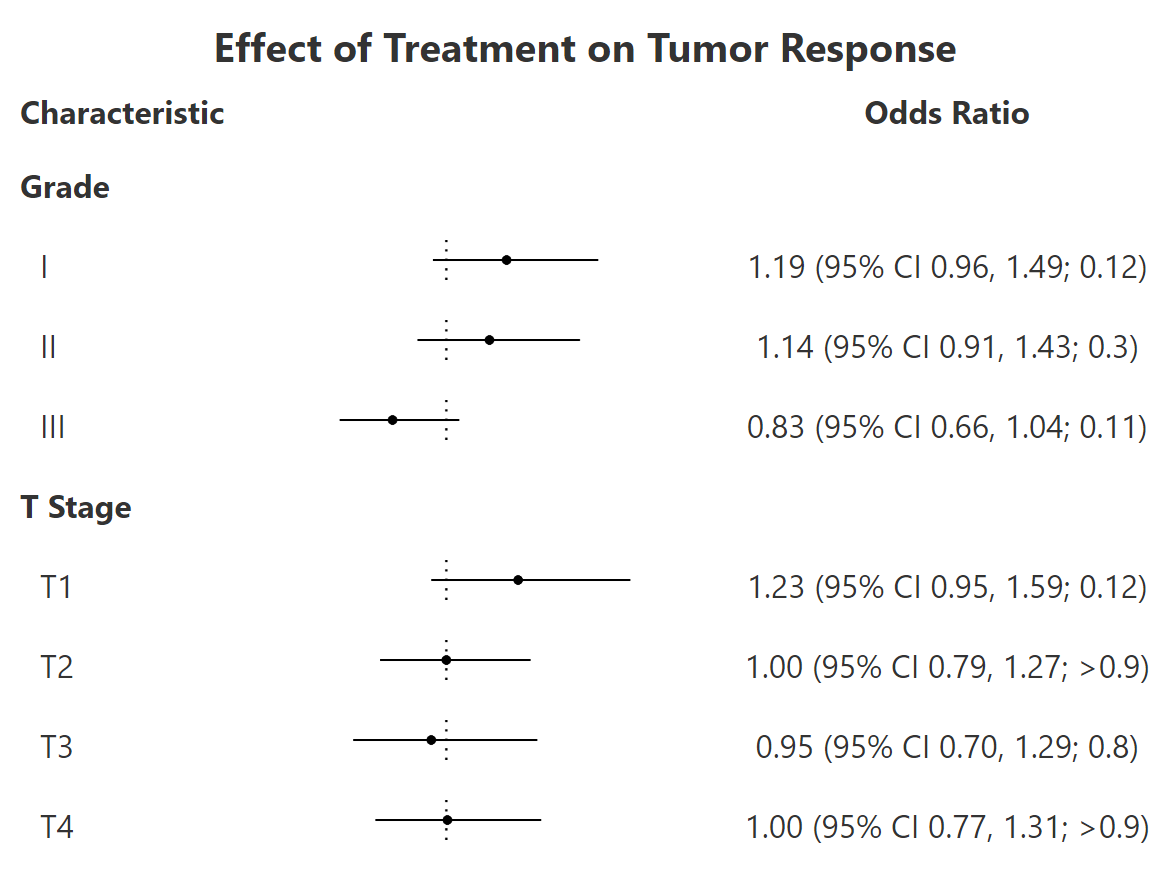
tbl <-
  trial %>%
  tbl_subgroups(
    subgroups = c("grade", "stage"),
    ~ glm(response ~ trt, data = .x) %>%
      gtsummary::tbl_regression(
        show_single_row = trt,
        exponentiate = TRUE)
  ) %>%
  gtsummary::modify_column_merge(
    pattern = "{estimate} (95% CI {ci}; {p.value})",
    rows = !is.na(estimate)
  ) %>%
  gtsummary::modify_header(estimate = "**Odds Ratio**") %>%
  gtsummary::bold_labels() %>%
  add_forest() %>%
  gt::tab_header(gt::md("**Effect of Treatment on Tumor Response**"))