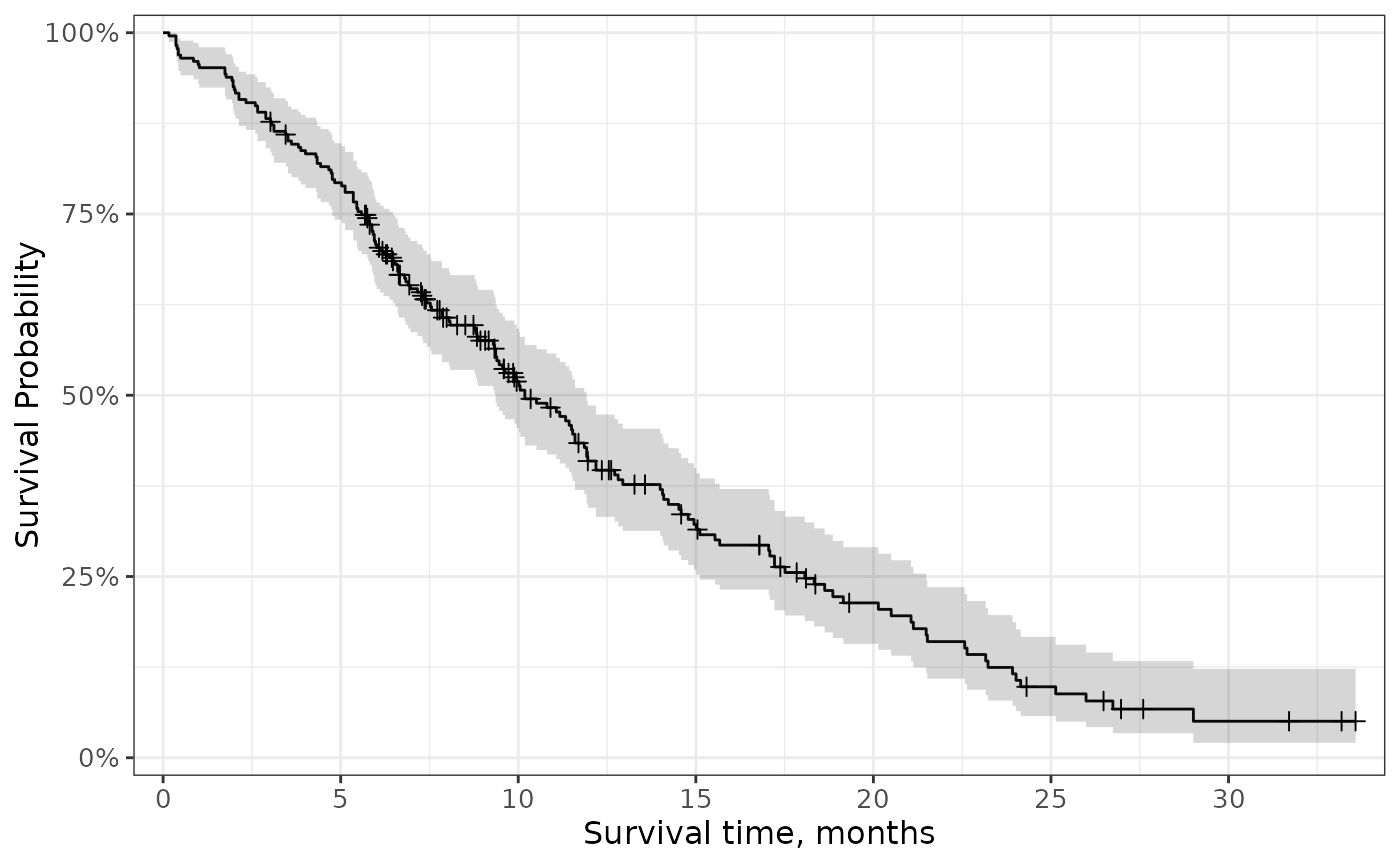
Add a marking on the figure to represent the time an observations was censored.
See also
Visit the gallery for examples modifying the default figures
Examples
survfit2(Surv(time, status) ~ 1, data = df_lung) %>%
  ggsurvfit() +
  add_confidence_interval() +
  add_censor_mark() +
  scale_ggsurvfit()