add_pvalue("caption"): Add a p-value to the figure viaggplot2::labs(caption=)add_pvalue("annotation"): Add a p-value text annotation viaggplot2::annotation("text")
P-values are calculated with survival::survdiff() or tidycmprsk::glance().
Examples of custom placement located in the help file for survfit_p().
When a competing risks figure includes multiple outcomes, only the p-value comparing stratum for the first outcome can be placed.
Usage
add_pvalue(
  location = c("caption", "annotation"),
  caption = "{p.value}",
  prepend_p = TRUE,
  pvalue_fun = format_p,
  rho = 0,
  ...
)
Arguments
- location
string indicating where to place p-value. Must be one of
c("caption", "annotation")- caption
string to be placed as the caption/annotation. String will be processed with
glue::glue(), and the default is"{p.value}"- prepend_p
prepend
"p="to formatted p-value- pvalue_fun
function to round and style p-value with
- rho
argument passed to
survival::survdiff(rho=)- ...
arguments passed to
ggplot2::annotate(). Commonly used arguments arex=andy=to place the p-value at the specified coordinates on the plot.
Examples
survfit2(Surv(time, status) ~ surg, df_colon) %>%
ggsurvfit() +
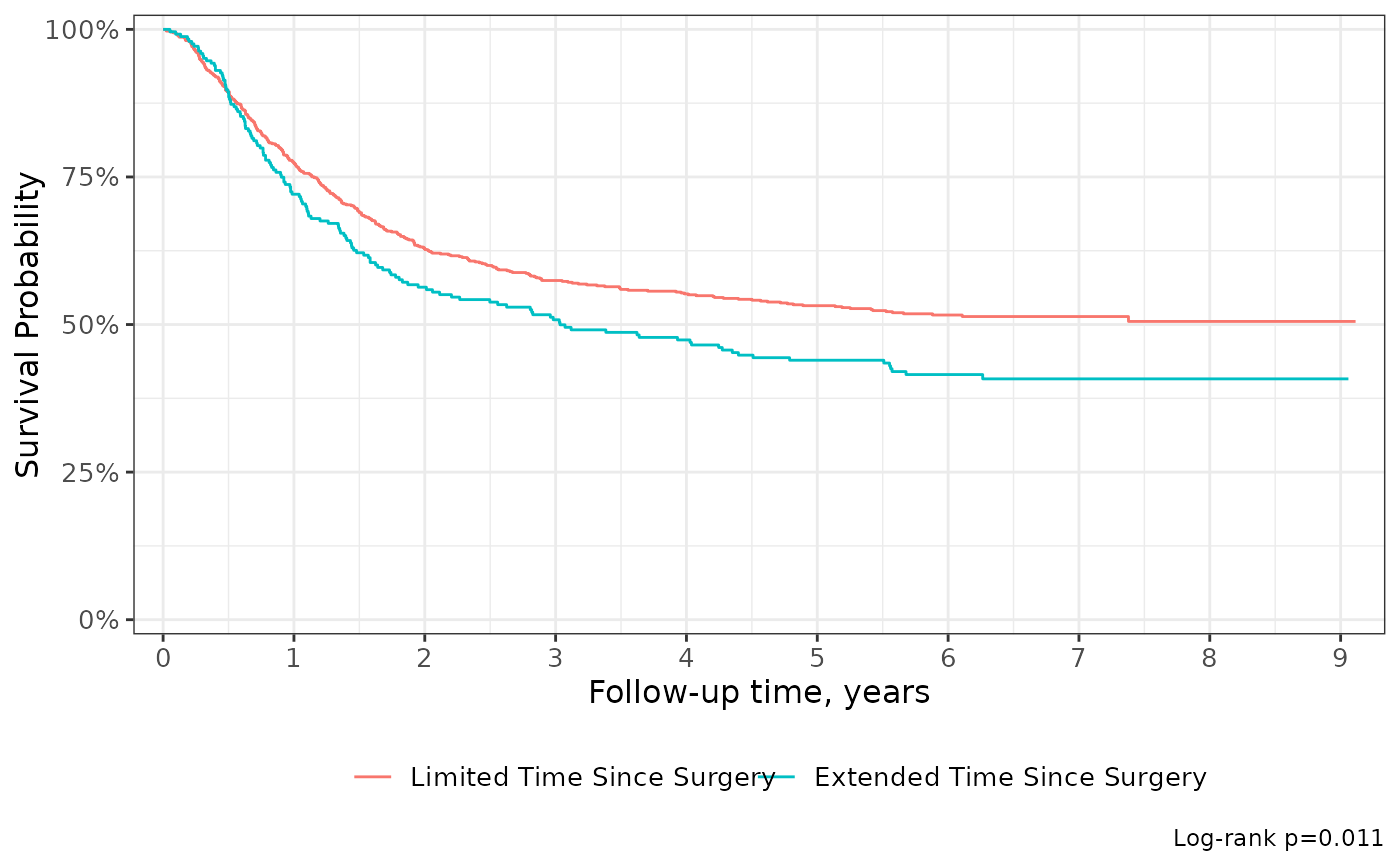
add_pvalue(caption = "Log-rank {p.value}") +
scale_ggsurvfit()
 survfit2(Surv(time, status) ~ surg, df_colon) %>%
ggsurvfit() +
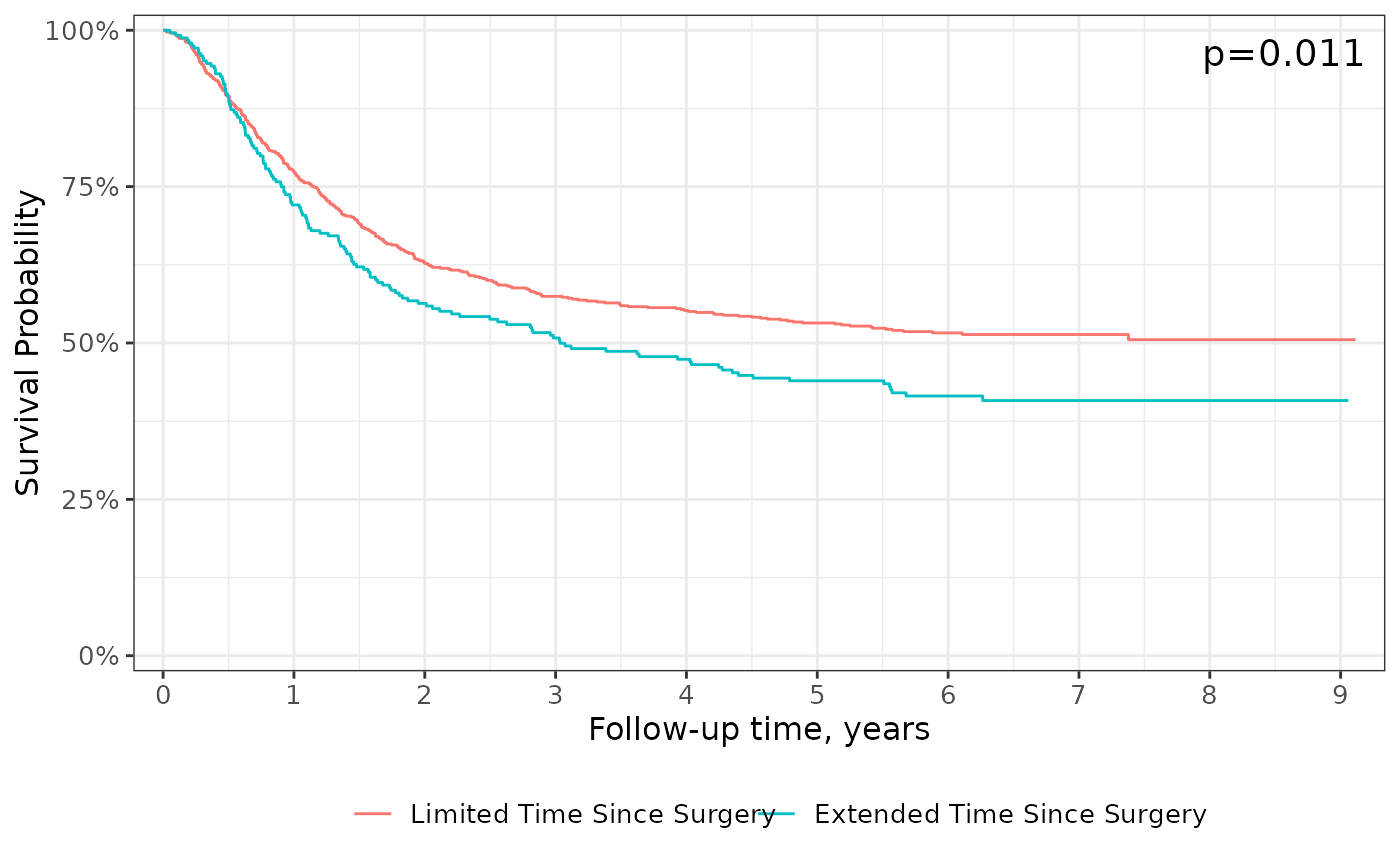
add_pvalue("annotation", size = 5) +
scale_ggsurvfit()
survfit2(Surv(time, status) ~ surg, df_colon) %>%
ggsurvfit() +
add_pvalue("annotation", size = 5) +
scale_ggsurvfit()