Add quantile information annotated on to the plot.
Arguments
- y_value, x_value
Numeric value where the line segment will be drawn. Default is
y_value=0.5when bothy_valueandx_valueare unassigned.- ...
Named arguments passed to
ggplot2::geom_segment()with defaultlinetype = 2
See also
Visit the gallery for examples modifying the default figures
Examples
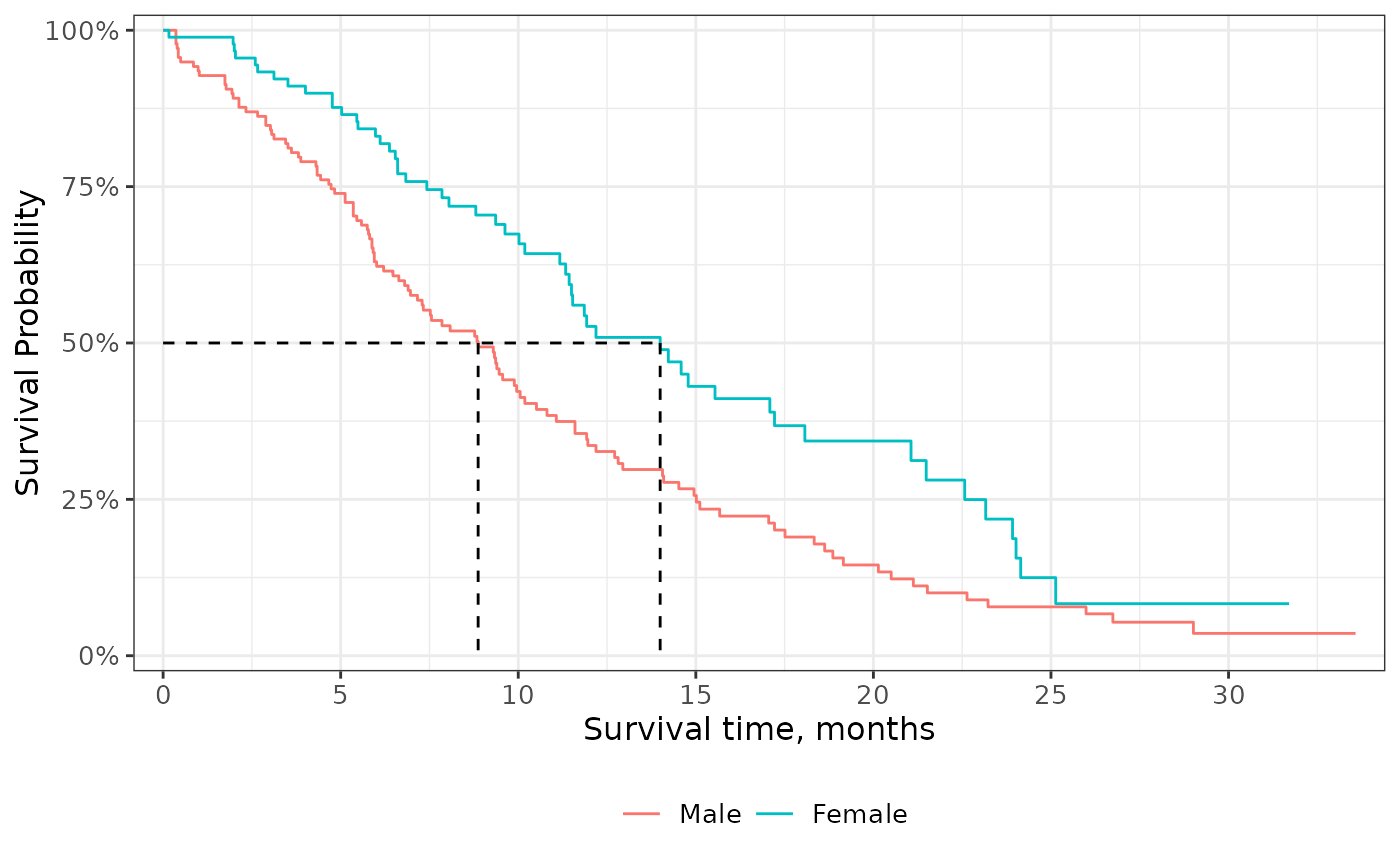
survfit2(Surv(time, status) ~ sex, data = df_lung) %>%
ggsurvfit() +
add_quantile(linetype = 2) +
scale_ggsurvfit()
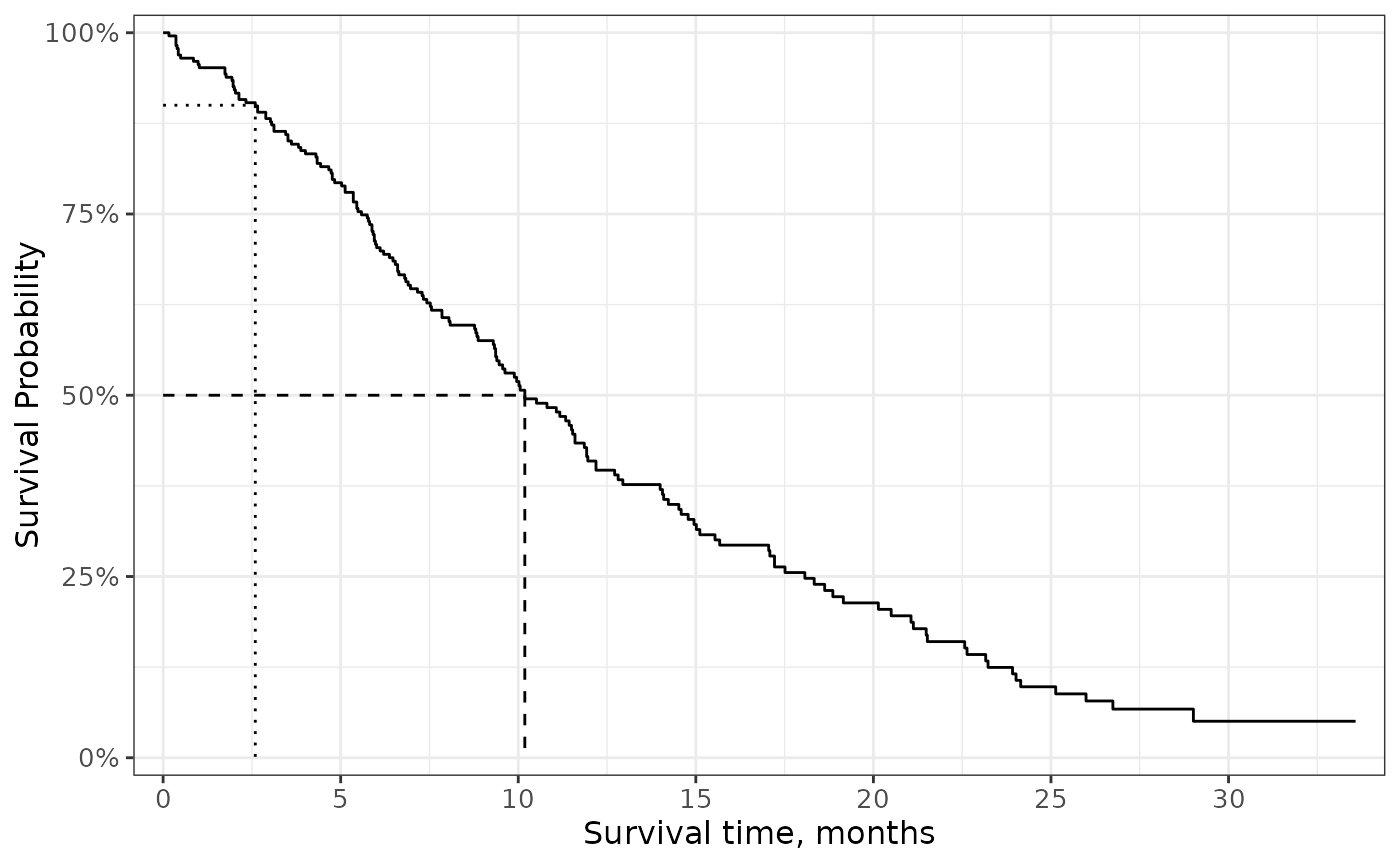
 survfit2(Surv(time, status) ~ 1, data = df_lung) %>%
ggsurvfit() +
add_quantile(linetype = 2) +
add_quantile(y_value = 0.9, linetype = 3) +
scale_ggsurvfit()
survfit2(Surv(time, status) ~ 1, data = df_lung) %>%
ggsurvfit() +
add_quantile(linetype = 2) +
add_quantile(y_value = 0.9, linetype = 3) +
scale_ggsurvfit()
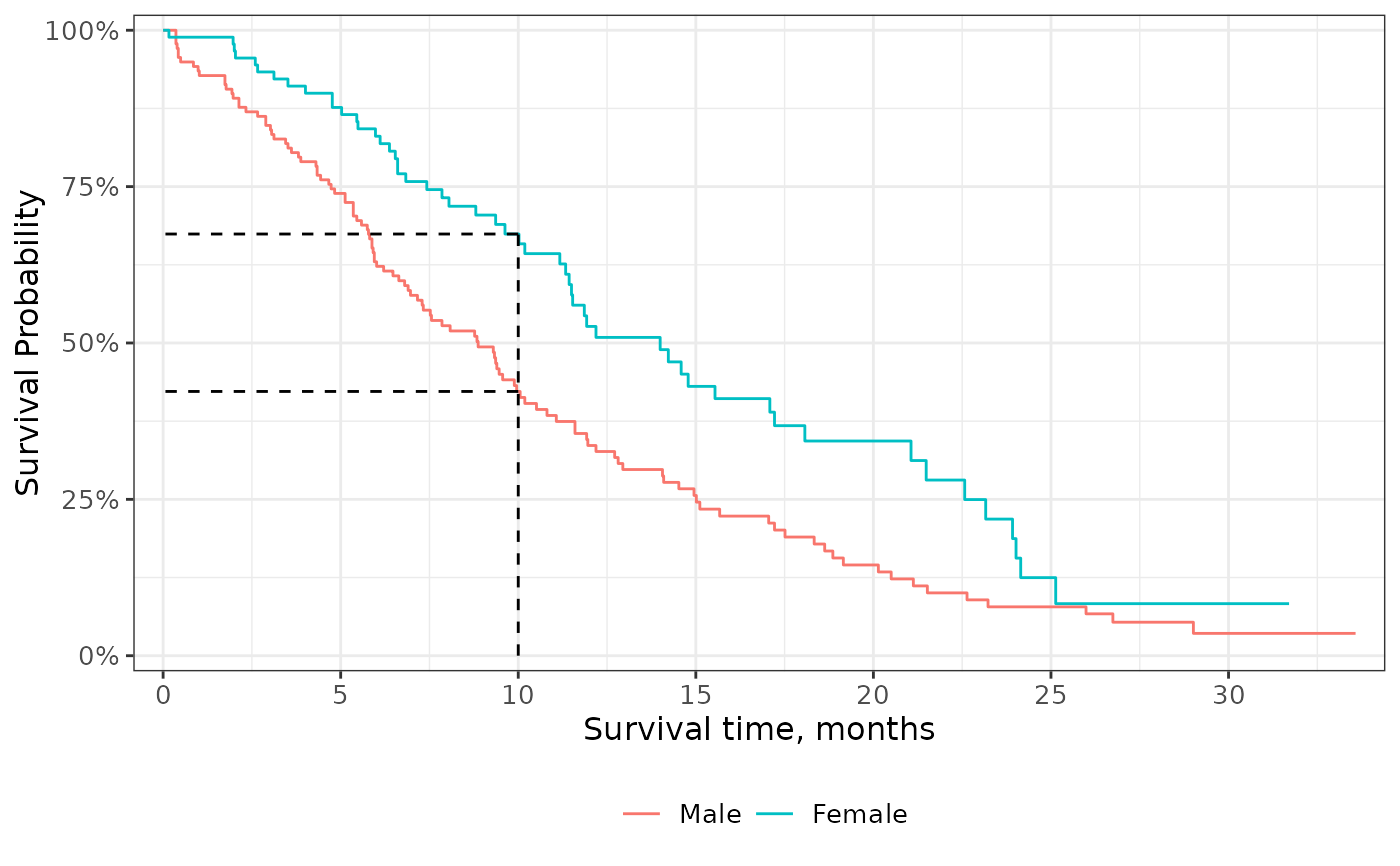
 survfit2(Surv(time, status) ~ sex, data = df_lung) %>%
ggsurvfit() +
add_quantile(linetype = 2, y_value = NULL, x_value = 10) +
scale_ggsurvfit()
survfit2(Surv(time, status) ~ sex, data = df_lung) %>%
ggsurvfit() +
add_quantile(linetype = 2, y_value = NULL, x_value = 10) +
scale_ggsurvfit()