Plot a cumulative incidence object created with tidycmprsk::cuminc()
or a multi-state object created with survfit2().
Read more on multi-state models here.
Usage
ggcuminc(
  x,
  outcome = NULL,
  linetype_aes = FALSE,
  theme = theme_ggsurvfit_default(),
  ...
)
Arguments
- x
a 'survfit' object created with
survfit2()- outcome
string indicating which outcome(s) to include in plot. Default is to include the first competing event.
- linetype_aes
logical indicating whether to add
ggplot2::aes(linetype = strata)to theggplot2::geom_step()call. When strata are present, the resulting figure will be a mix a various line types for each stratum.- theme
a survfit theme. Default is
theme_ggsurvfit_default()- ...
arguments passed to
ggplot2::geom_step(...), e.g.size = 2
Details
Why not use cmprsk::cuminc()?
The implementation of cmprsk::cuminc() does not provide the data required
to construct the risk table. Moreover, the tidycmprsk::cuminc() has a
user-friendly interface making it easy to learn and use.
See also
Visit the gallery for examples modifying the default figures
Examples
# \donttest{
library(tidycmprsk)
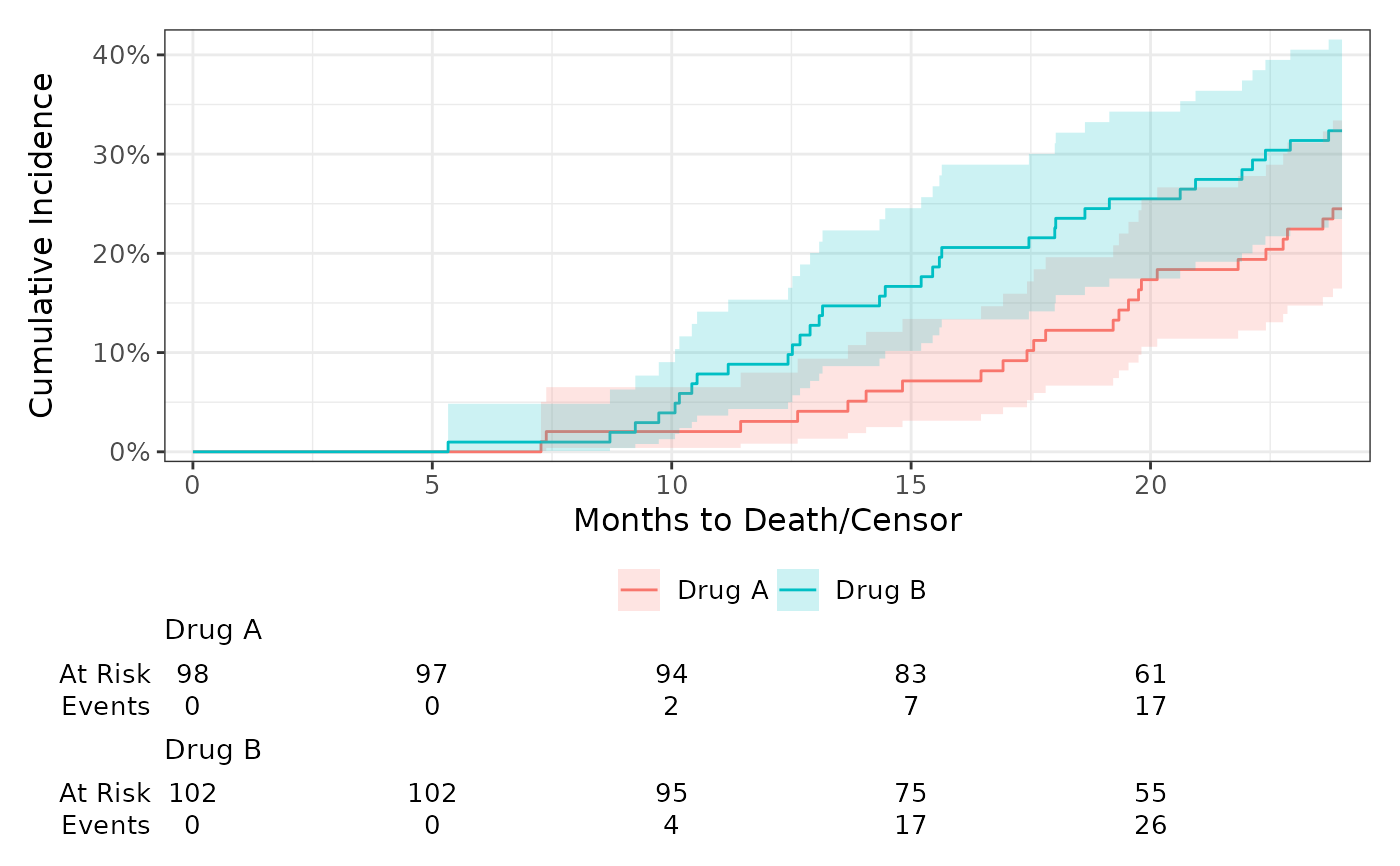
cuminc(Surv(ttdeath, death_cr) ~ trt, trial) %>%
ggcuminc(outcome = "death from cancer") +
add_confidence_interval() +
add_risktable() +
scale_ggsurvfit()
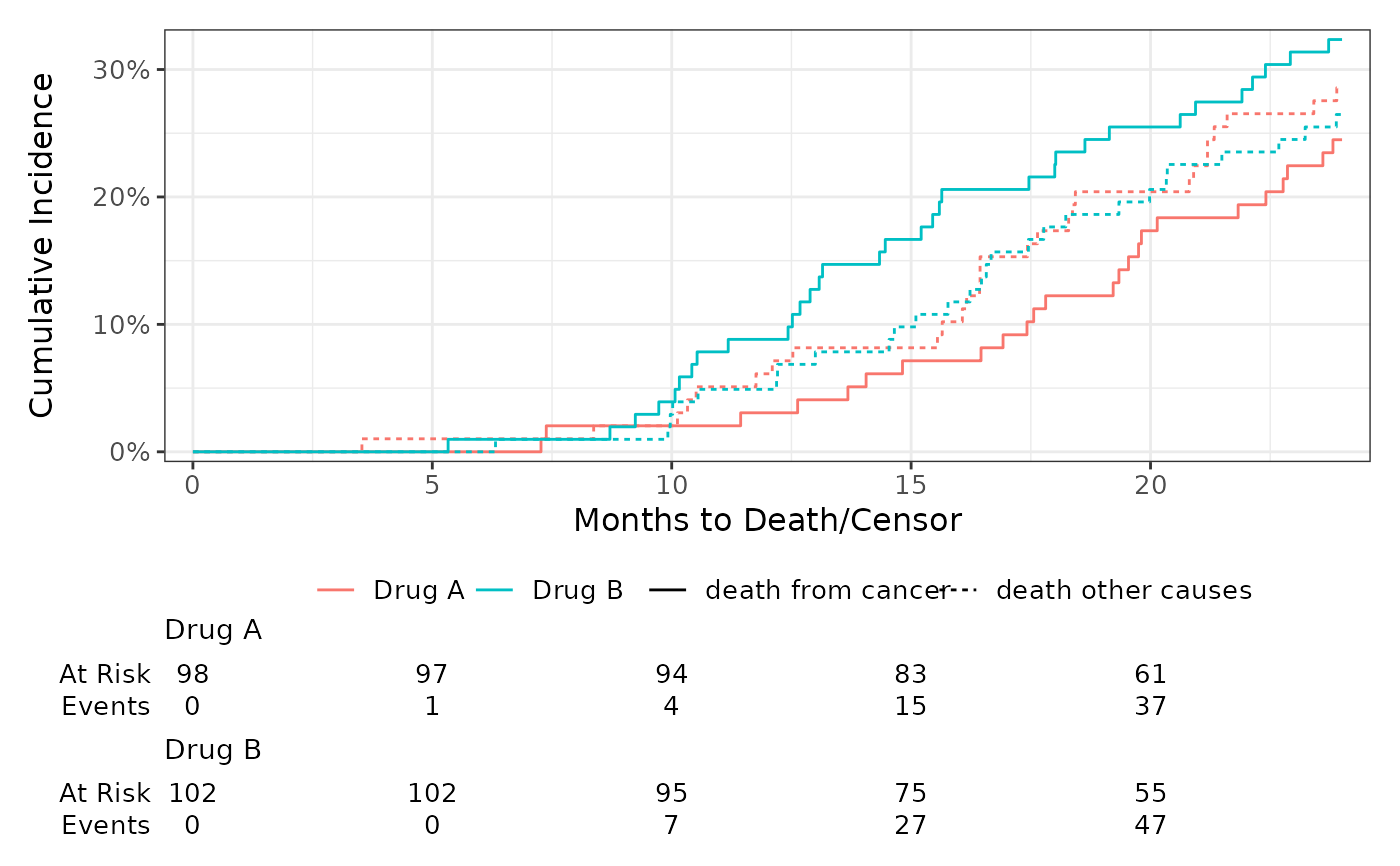
 cuminc(Surv(ttdeath, death_cr) ~ trt, trial) %>%
ggcuminc(outcome = c("death from cancer", "death other causes")) +
add_risktable() +
scale_ggsurvfit()
cuminc(Surv(ttdeath, death_cr) ~ trt, trial) %>%
ggcuminc(outcome = c("death from cancer", "death other causes")) +
add_risktable() +
scale_ggsurvfit()
 # using the survival multi-state model
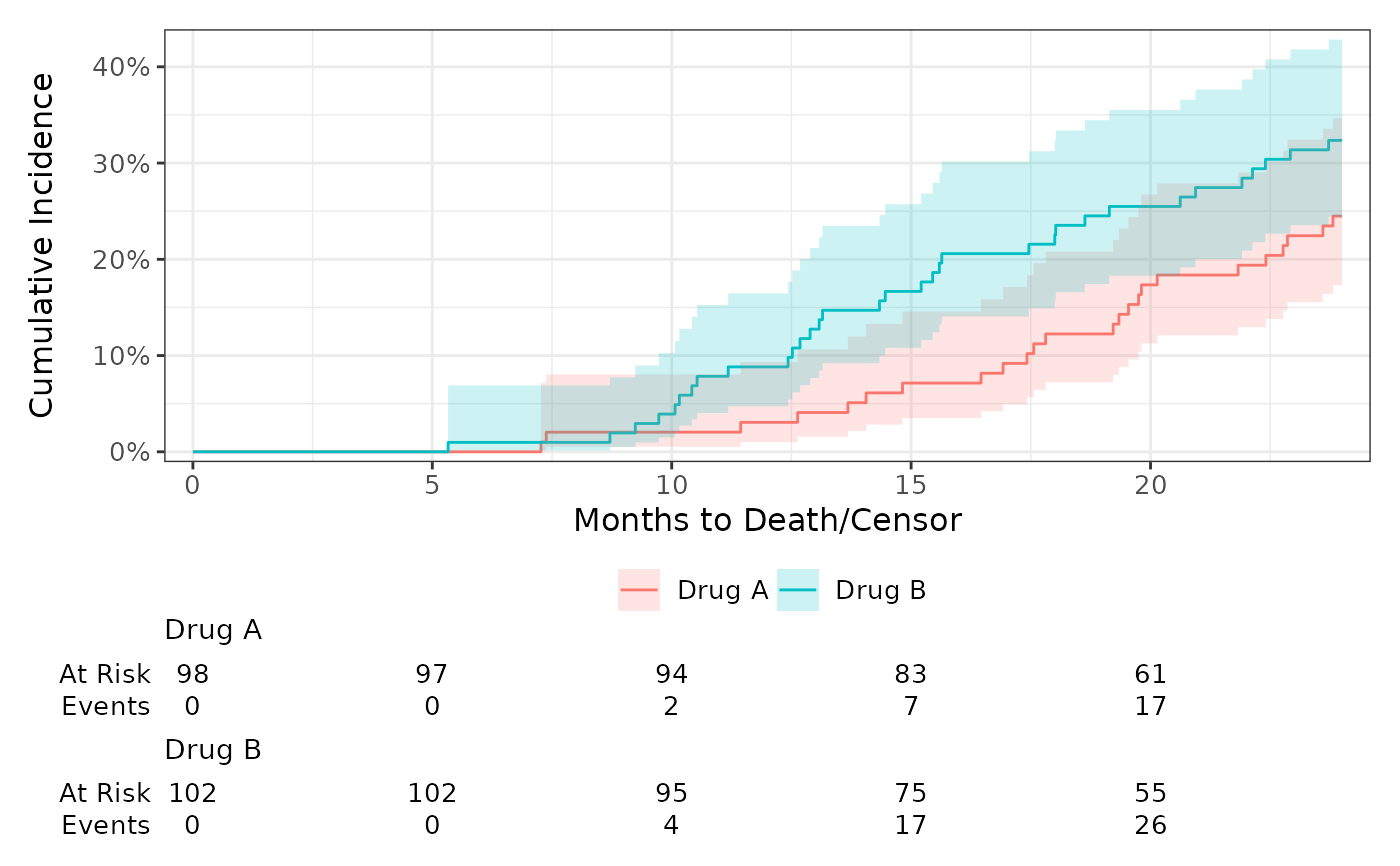
survfit2(Surv(ttdeath, death_cr) ~ trt, trial) %>%
ggcuminc(outcome = "death from cancer") +
add_confidence_interval() +
add_risktable() +
scale_ggsurvfit()
# using the survival multi-state model
survfit2(Surv(ttdeath, death_cr) ~ trt, trial) %>%
ggcuminc(outcome = "death from cancer") +
add_confidence_interval() +
add_risktable() +
scale_ggsurvfit()
 # }
# }