gtsummary 
The {gtsummary} package provides an elegant and flexible way to create publication-ready analytical and summary tables using the R programming language. The {gtsummary} package summarizes data sets, regression models, and more, using sensible defaults with highly customizable capabilities.
The package is widely used across clinical and pharmaceutical research for reporting clinical trials—from baseline demographics and adverse event summaries to efficacy analyses. Every table is computed from a structured, machine-readable Analysis Results Dataset (ARD)—part of the CDISC Analysis Results Standard—via the pharmaverse {cards} and {cardx} packages, making results traceable and straightforward to QC.
Summarize data frames or tibbles easily in R. Perfect for presenting descriptive statistics, comparing group demographics (e.g creating a Table 1 for medical journals), and more. Automatically detects continuous, categorical, and dichotomous variables in your data set, calculates appropriate descriptive statistics, and also includes amount of missingness in each variable.
Summarize regression models in R and include reference rows for categorical variables. Common regression models, such as logistic regression and Cox proportional hazards regression, are automatically identified and the tables are pre-filled with appropriate column headers (i.e. Odds Ratio and Hazard Ratio).
Customize gtsummary tables using a growing list of formatting/styling functions. Bold labels, italicize levels, add p-value to summary tables, style the statistics however you choose, merge or stack tables to present results side by side… there are so many possibilities to create the table of your dreams!
Report statistics inline from summary tables and regression summary tables in R markdown. Make your reports completely reproducible!
By leveraging {broom}, {gt}, and {labelled} packages, {gtsummary} creates beautifully formatted, ready-to-share summary and result tables in a single line of R code!
Check out the examples below, review the vignettes for a detailed exploration of the output options, and view the gallery for various customization examples.
Installation
The {gtsummary} package was written as a companion to the {gt} package from RStudio. You can install {gtsummary} with the following code.
install.packages("gtsummary")Install the development version with pak::pkg_install("ddsjoberg/gtsummary", dependencies = TRUE)
Examples
Summary Table
Use tbl_summary() to summarize a data frame.
Example basic table:
library(gtsummary)

# summarize the data with our package
table1 <-
  trial |>
  tbl_summary(include = c(age, grade, response))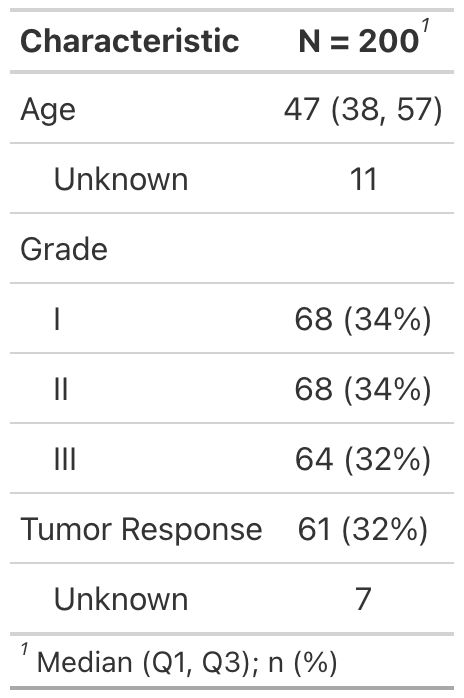
There are many customization options to add information (like comparing groups) and format results (like bold labels) in your table. See the tbl_summary() tutorial for many more options, or below for one example.
table2 <-
  tbl_summary(
    trial,
    include = c(age, grade, response),
    by = trt, # split table by group
    missing = "no" # don't list missing data separately
  ) |>
  add_n() |> # add column with total number of non-missing observations
  add_p() |> # test for a difference between groups
  modify_header(label = "**Variable**") |> # update the column header
  bold_labels()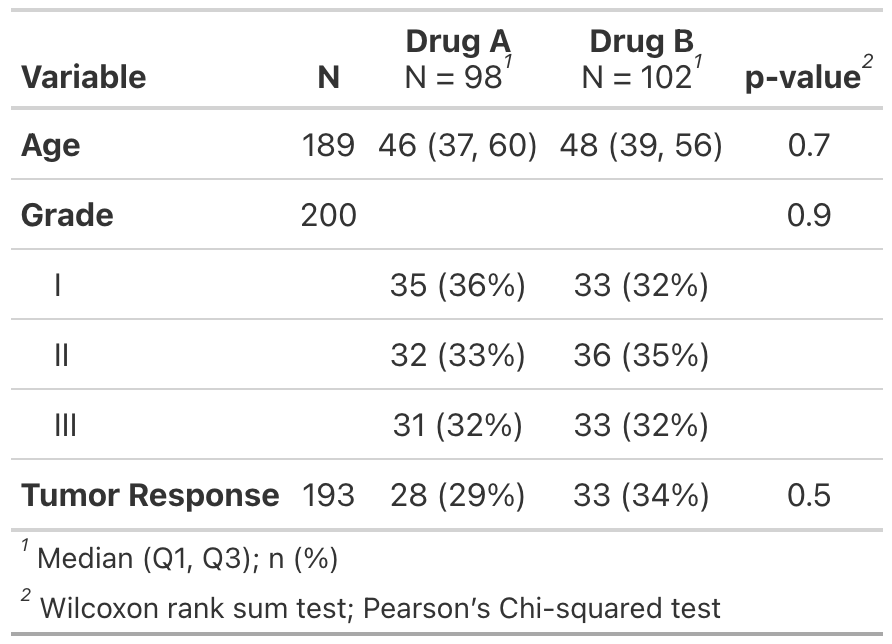
Regression Models
Use tbl_regression() to easily and beautifully display regression model results in a table. See the tutorial for customization options.
mod1 <- glm(response ~ trt + age + grade, trial, family = binomial)

t1 <- tbl_regression(mod1, exponentiate = TRUE)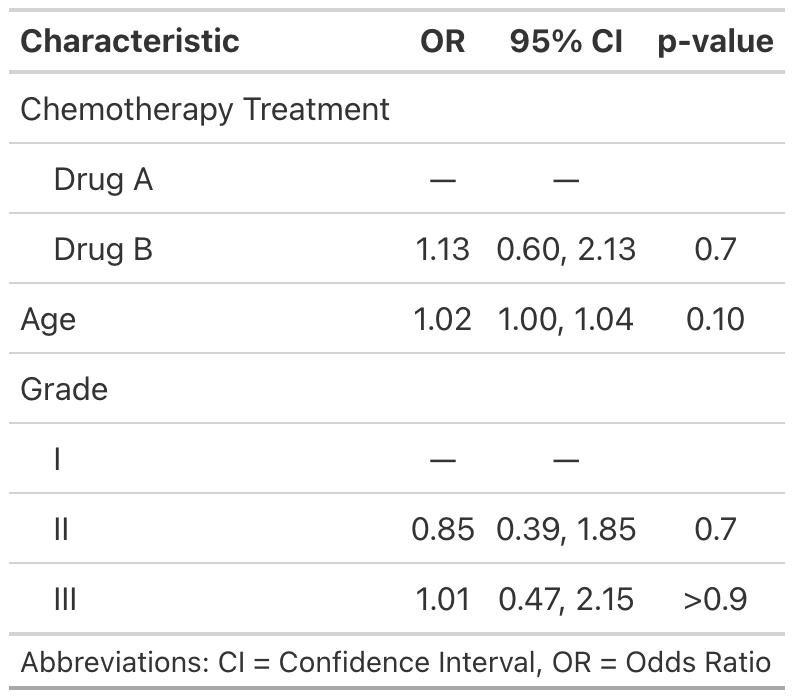
Side-by-side Regression Models
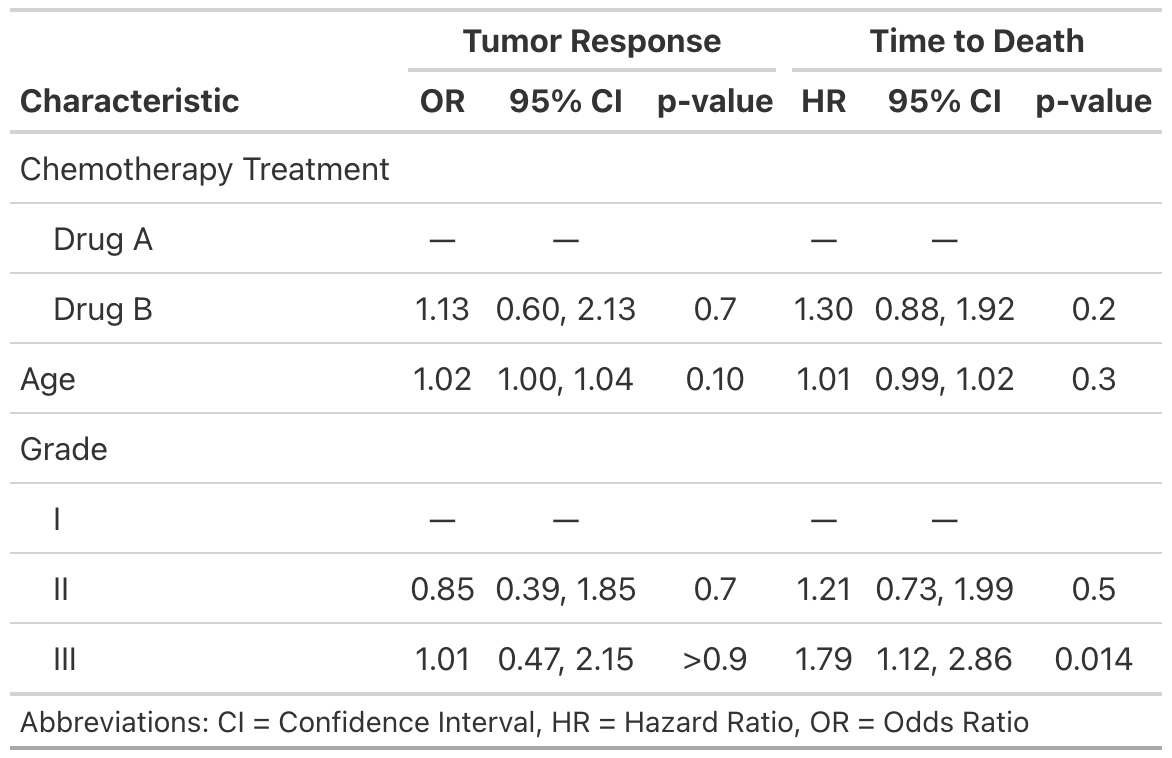
You can also present side-by-side regression model results using tbl_merge()
library(survival)

# build survival model table
t2 <-
  coxph(Surv(ttdeath, death) ~ trt + grade + age, trial) |>
  tbl_regression(exponentiate = TRUE)

# merge tables
tbl_merge_ex1 <-
  tbl_merge(
    tbls = list(t1, t2),
    tab_spanner = c("**Tumor Response**", "**Time to Death**")
  )
Review even more output options in the table gallery.
Clinical & Pharmaceutical Research
{gtsummary} is a natural fit for clinical trial reporting. Below we highlight two features that clinical and pharmaceutical teams rely on: safety tables and built-in QC via the ARD backend. Both examples use the CDISC pilot data (ADAE/ADSL) shipped with the {cards} package.
Adverse Event Tables
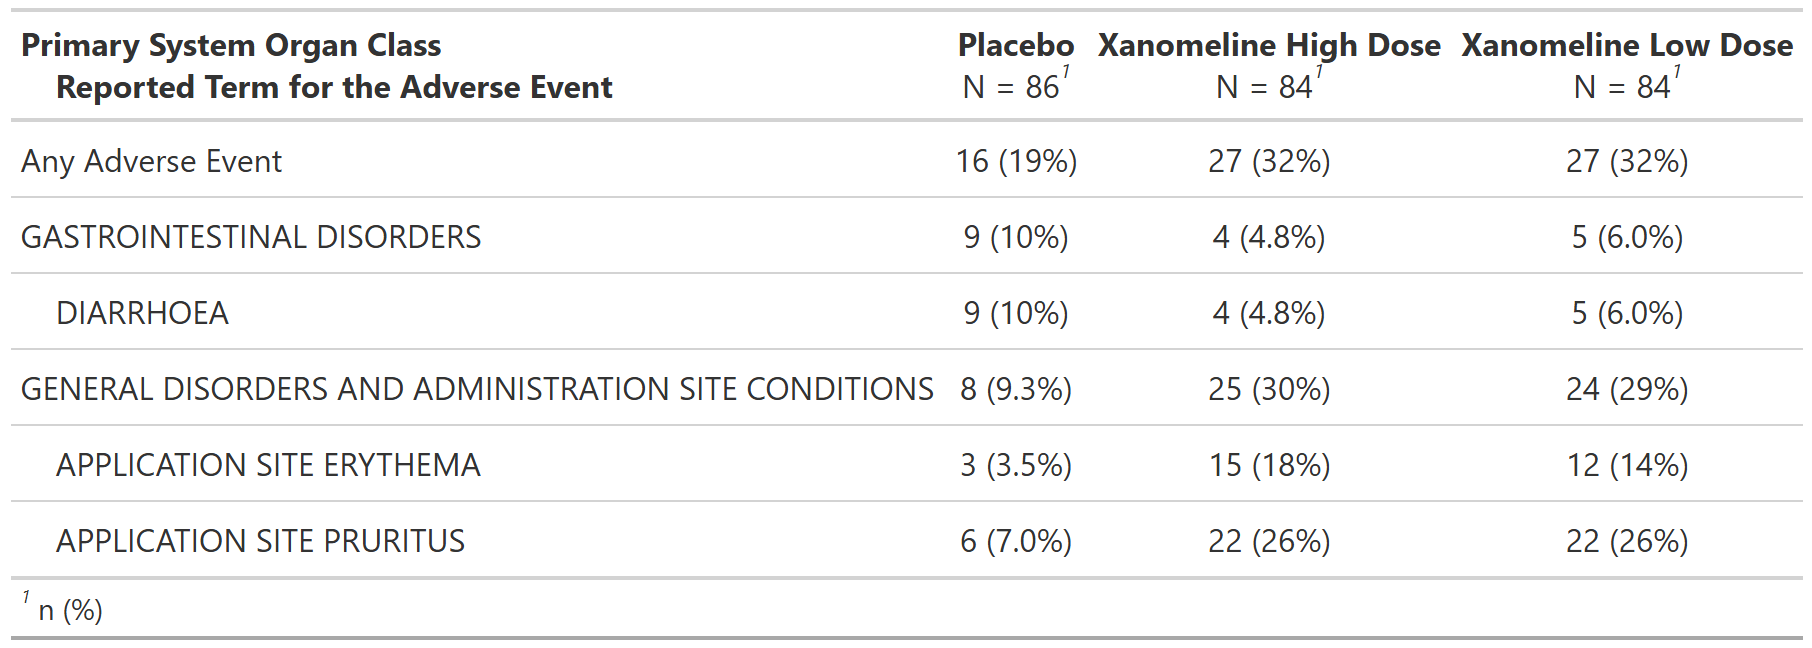
Use tbl_hierarchical() to build nested adverse event summaries by treatment arm—counts of patients with an event, organized by System Organ Class and Preferred Term—following FDA Standard Safety Table conventions.
library(cards) # provides the ADAE / ADSL CDISC pilot datasets

tbl_ae <-
  ADAE |>
  # filter to a few System Organ Classes and Preferred Terms for a compact display
  dplyr::filter(
    AESOC %in% unique(cards::ADAE$AESOC)[1:3],
    AETERM %in% unique(cards::ADAE$AETERM)[1:3]
  ) |>
  tbl_hierarchical(
    variables = c(AESOC, AETERM),
    by = TRTA, # summarize by treatment arm
    denominator = cards::ADSL,
    id = USUBJID, # count unique patients, not events
    overall_row = TRUE,
    label = list(..ard_hierarchical_overall.. = "Any Adverse Event")
  )
Built-in QC with the ARD Backend
Because every {gtsummary} table is computed from an Analysis Results Dataset (ARD)—a structured, machine-readable record of every statistic, part of the CDISC Analysis Results Standard—you can extract the numbers behind any table with gather_ard(). Each statistic becomes one row, making it simple to QC results, trace a value back to its calculation, or compare against an independently double-programmed dataset.
For example, the adverse event counts behind the table above are stored as individual records—one for each event count (n), denominator (N), and percentage (p) in every treatment arm:
tbl_ae |>
  gather_ard() |>
  bind_ard() |>
  # keep the adverse event term counts and the columns identifying each statistic
  dplyr::filter(variable == "AETERM") |>
  dplyr::select(group1_level, variable_level, stat_name, stat)
#> # An ARD data frame: 27 × 4
#>    group1_level         variable_level            stat_name    stat
#>    <list>               <list>                    <chr>      <list>
#>  1 Placebo              DIARRHOEA                 n          9
#>  2 Placebo              DIARRHOEA                 N         86
#>  3 Placebo              DIARRHOEA                 p          0.105
#>  4 Xanomeline High Dose DIARRHOEA                 n          4
#>  5 Xanomeline High Dose DIARRHOEA                 N         84
#>  6 Xanomeline High Dose DIARRHOEA                 p          0.0476
#>  7 Xanomeline Low Dose  DIARRHOEA                 n          5
#>  8 Xanomeline Low Dose  DIARRHOEA                 N         84
#>  9 Xanomeline Low Dose  DIARRHOEA                 p          0.0595
#> 10 Placebo              APPLICATION SITE ERYTHEMA n          3
#> # ℹ 17 more rows
For the full CDISC/ARD workflow—including the tbl_ard_*() constructors that build tables directly from an ARD—see the ARD-first Tables article.
gtsummary + R Markdown
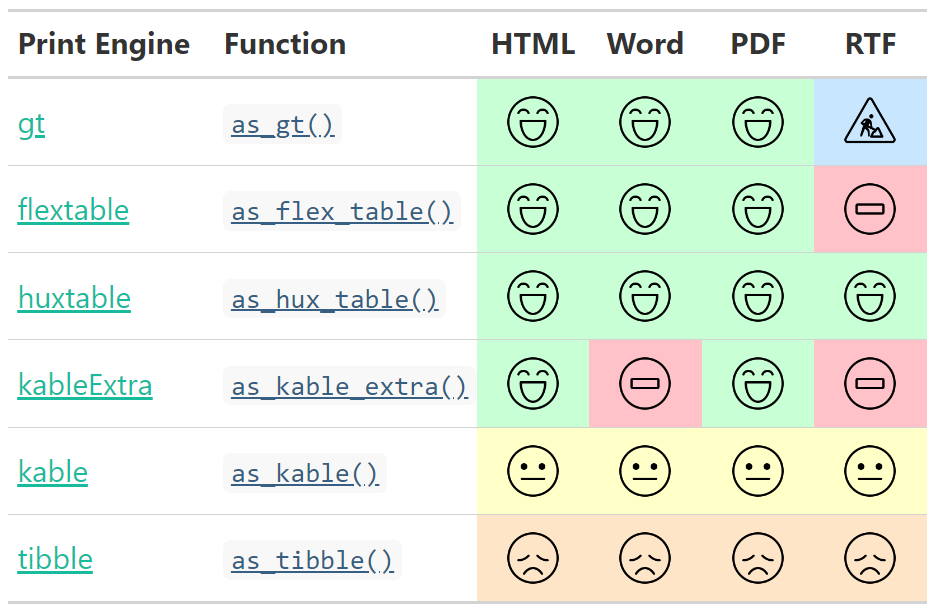
The {gtsummary} package was written to be a companion to the {gt} package from RStudio. But not all output types are supported by the {gt} package. Therefore, we have made it possible to print {gtsummary} tables with various engines.
Review the gtsummary + R Markdown vignette for details.
Save Individual Tables
{gtsummary} tables can also be saved directly to file as an image, HTML, Word, RTF, and LaTeX file.
For submission-ready deliverables, convert to a {flextable} with as_flex_table() for polished RTF and Word output, or save straight to a Word document with save_flex_docx().
Cite gtsummary
> citation("gtsummary")

To cite gtsummary in publications use:

  Sjoberg DD, Whiting K, Curry M, Lavery JA, Larmarange J. Reproducible summary tables with the gtsummary package.
  The R Journal 2021;13:570–80. https://doi.org/10.32614/RJ-2021-053.

A BibTeX entry for LaTeX users is

  @Article{gtsummary,
    author = {Daniel D. Sjoberg and Karissa Whiting and Michael Curry and Jessica A. Lavery and Joseph Larmarange},
    title = {Reproducible Summary Tables with the gtsummary Package},
    journal = {{The R Journal}},
    year = {2021},
    url = {https://doi.org/10.32614/RJ-2021-053},
    doi = {10.32614/RJ-2021-053},
    volume = {13},
    issue = {1},
    pages = {570-580},
  }
Contributing
Big thank you to @jeffreybears for the hex sticker!
Please note that the {gtsummary} project is released with a Contributor Code of Conduct. By contributing to this project, you agree to abide by its terms. Thank you to all contributors!