The plot() function extracts x$table_body and passes the it to
ggstats::ggcoef_plot() along with formatting options.
Usage
# S3 method for class 'tbl_regression'
plot(x, remove_header_rows = TRUE, remove_reference_rows = FALSE, ...)

# S3 method for class 'tbl_uvregression'
plot(x, remove_header_rows = TRUE, remove_reference_rows = FALSE, ...)
Arguments
- x
(
tbl_regression,tbl_uvregression)
A 'tbl_regression' or 'tbl_uvregression' object- remove_header_rows
(scalar
logical)
logical indicating whether to remove header rows for categorical variables. Default isTRUE- remove_reference_rows
(scalar
logical)
logical indicating whether to remove reference rows for categorical variables. Default isFALSE.- ...
arguments passed to
ggstats::ggcoef_plot(...)
Examples
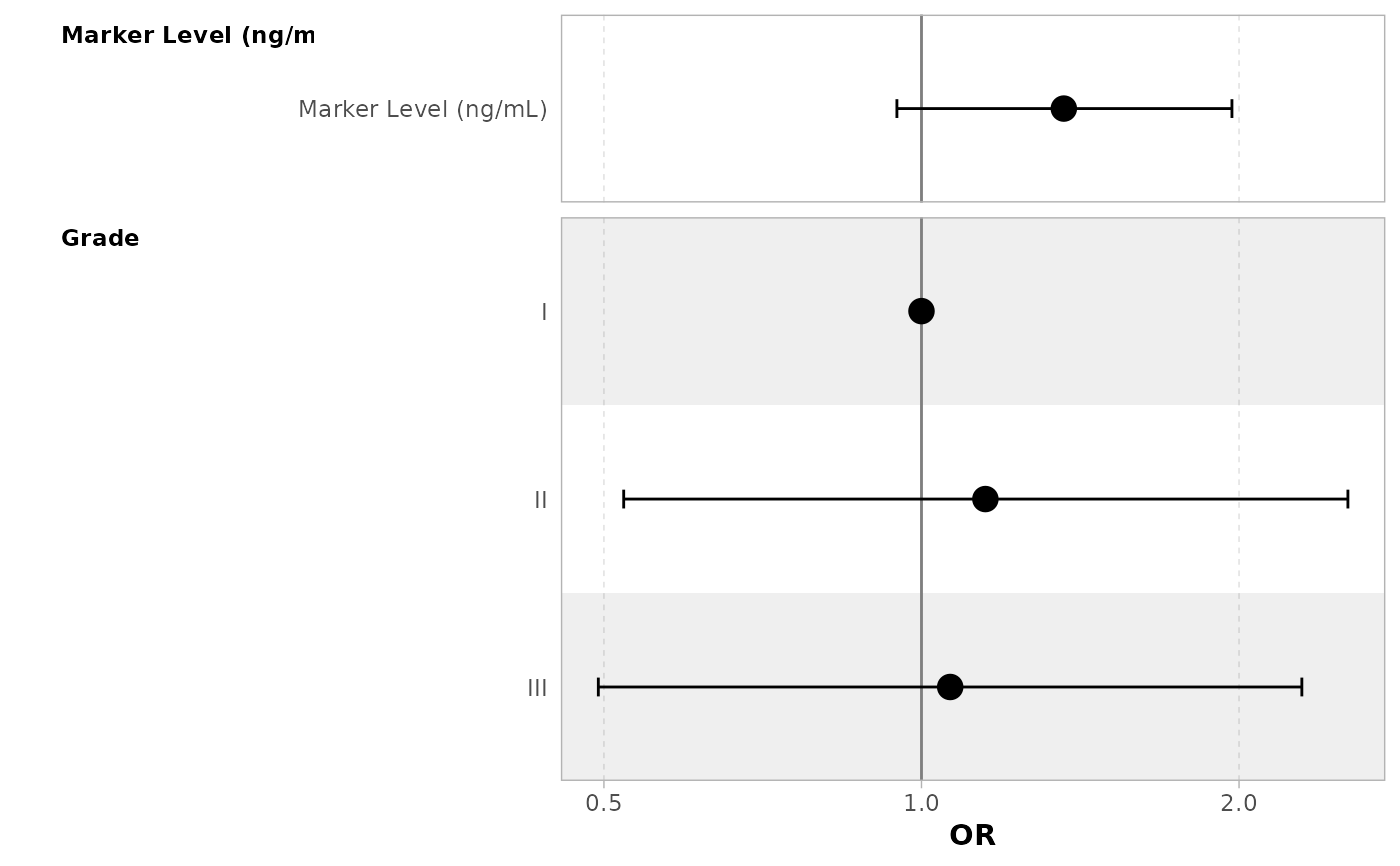
glm(response ~ marker + grade, trial, family = binomial) |>
  tbl_regression(
    add_estimate_to_reference_rows = TRUE,
    exponentiate = TRUE
  ) |>
  plot()